TPT
Total:
$0.00

Finding Slope and Y-Intercept from a Table

Rated 4.83 out of 5, based on 99 reviews
4.8 (99 ratings)
17,661 Downloads
;
Miss Kuiper's Classroom
1.1k Followers
Grade Levels
7th - 9th
Standards
Formats Included
  • PDF
Pages
2 Worksheets
FREE
FREE
Share this resource
Report this resource to TPT
Miss Kuiper's Classroom
1.1k Followers
Easel Activity Included
This resource includes a ready-to-use interactive activity students can complete on any device.  Easel by TPT is free to use! Learn more.

Description

Are you looking for an activity to help students in finding slope and y-intercept from a table? Miss Kuiper's Classroom has you covered with this scaffolded finding slope and y-intercept form a table activity!

This resource includes

  • Page 4: Common Core Standards
  • Page 5: Directions
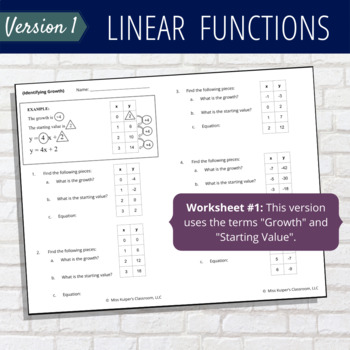
  • Page 6 & 7: Worksheet #1 → Uses the terms “Growth” & “Starting Value”
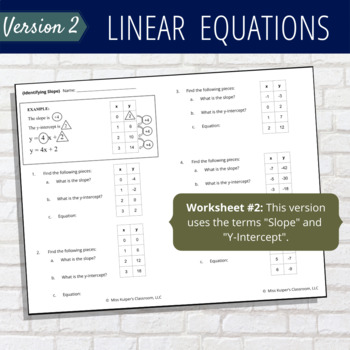
  • Page 8 & 9: Worksheet #2 → Uses the terms “Slope” & “Y-Intercept”
  • Page 10: Answer Key

✨How This Activity Works✨

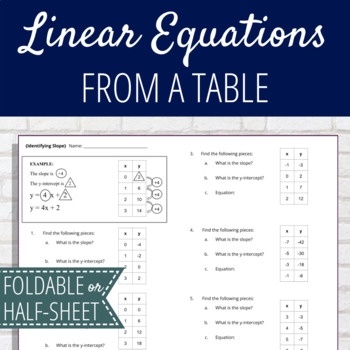
Students will practice finding the growth and starting value from a table. Then they will create a linear equation from that information. The worksheet includes a visual to help students see how to calculate the slope and y-intercept from the table. Some of the tables do not include the starting value, which allow students to practice expanding the table to find it.

How can you use this?

  • Re-teaching activity
  • Fast finisher activity
  • Review before an assessment
  • Math centers or stations
  • Flipped classroom activity

Connect with Me!

© Miss Kuiper's Classroom, LLC

All rights reserved by author. This product is to be used by the original downloader only. Copying for more than one teacher, classroom, department, school, or school system is prohibited. This product may not be distributed or displayed digitally for public view. Failure to comply is a copyright infringement and a violation of the Digital Millennium Copyright Act (DMCA). Intended for classroom and personal use ONLY.

Total Pages
2 Worksheets
Answer Key
Included
Teaching Duration
1 hour
Report this resource to TPT
Reported resources will be reviewed by our team. Report this resource to let us know if this resource violates TPT’s content guidelines.

Standards

to see state-specific standards (only available in the US).
Compare properties of two functions each represented in a different way (algebraically, graphically, numerically in tables, or by verbal descriptions). For example, given a linear function represented by a table of values and a linear function represented by an algebraic expression, determine which function has the greater rate of change.
Interpret the equation 𝘺 = 𝘮𝘹 + 𝘣 as defining a linear function, whose graph is a straight line; give examples of functions that are not linear. For example, the function 𝘈 = 𝑠² giving the area of a square as a function of its side length is not linear because its graph contains the points (1,1), (2,4) and (3,9), which are not on a straight line.
Construct a function to model a linear relationship between two quantities. Determine the rate of change and initial value of the function from a description of a relationship or from two (𝘹, 𝘺) values, including reading these from a table or from a graph. Interpret the rate of change and initial value of a linear function in terms of the situation it models, and in terms of its graph or a table of values.

Reviews

Questions & Answers