Nicole Boire
68 Followers
Grade Levels
PreK - 2nd
Subjects
Resource Type
Standards
CCSSK.MD.B.3
CCSS1.MD.C.4
CCSS2.MD.D.10
Formats Included
- XLS
Pages
1 page
Nicole Boire
68 Followers
Description
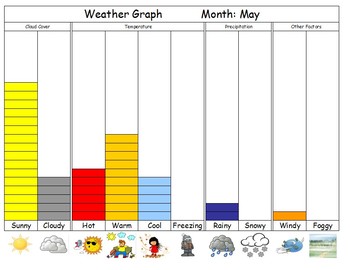
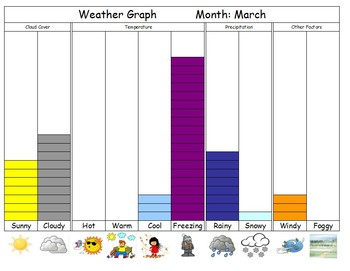
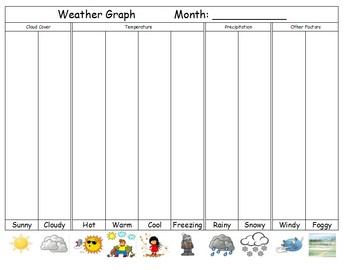
I use this excel sheet to graph the weather each day. Simply copy the rectangle under the weather, and paste it in its column to form a bar graph. Every month, save and print the weather, then start fresh with a new sheet. You can then compare weather in September to weather in January to weather in April. Make sure page layout is landscape and margins are set to "narrow" before printing!
I project this excel sheet onto our smartboard, so that the students can see the data and count/analyze as the month goes on. I ask the "Weather Helper" questions like "What's the temperature today?" and then I input the data. I allow students to choose "both" for cloudy and sunny if they think that's the case. If you want to add a "partly cloudy" option to your graph, feel free!
I project this excel sheet onto our smartboard, so that the students can see the data and count/analyze as the month goes on. I ask the "Weather Helper" questions like "What's the temperature today?" and then I input the data. I allow students to choose "both" for cloudy and sunny if they think that's the case. If you want to add a "partly cloudy" option to your graph, feel free!
Total Pages
1 page
Answer Key
N/A
Teaching Duration
N/A
Report this resource to TPT
Reported resources will be reviewed by our team. Report this resource to let us know if this resource violates TPT’s content guidelines.
Standards
to see state-specific standards (only available in the US).
CCSSK.MD.B.3
Classify objects into given categories; count the numbers of objects in each category and sort the categories by count.
CCSS1.MD.C.4
Organize, represent, and interpret data with up to three categories; ask and answer questions about the total number of data points, how many in each category, and how many more or less are in one category than in another.
CCSS2.MD.D.10
Draw a picture graph and a bar graph (with single-unit scale) to represent a data set with up to four categories. Solve simple put-together, take-apart, and compare problems using information presented in a bar graph.


