Eureka Math Grade 3 Modules 1 -7
Alexandra Hollowell
82 Followers
Grade Levels
3rd
Subjects
Resource Type
Standards
CCSS3.MD.A.1
CCSS3.MD.A.2
CCSS3.MD.B.3
CCSS3.MD.B.4
CCSS3.MD.C.5
Formats Included
- Zip
Alexandra Hollowell
82 Followers
Products in this Bundle (12)
showing 1-5 of 12 products
Description
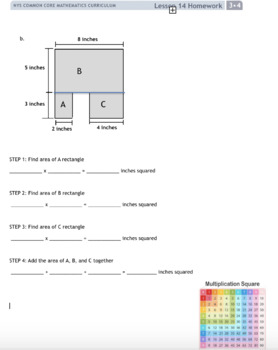
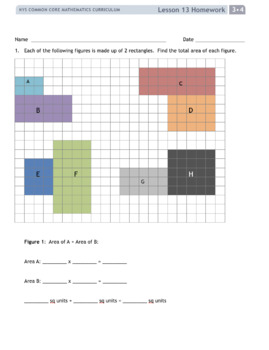
This zip includes Eureka Math Grade 3 modifications for Homework and Exit Tickets for all lessons. I have also included the Mid- Module Assessments and End of Module Assessments that is modified. The modifications were done to accommodate students with Individualized educational plans (IEP).
Module 1: Properties of Multiplication and Division and Solving Problems with Units of 2–5 and 10 Module 2: Place Value and Problem Solving with Units of Measure
Module 3: Multiplication and Division with Units of 0, 1, 6–9, and Multiples of 10
Module 4: Multiplication and Area
Module 5: Fractions as Numbers on the Number Line Module 6: Collecting and Displaying Data
Module 7: Geometry and Measurement Word Problems
Total Pages
Answer Key
N/A
Teaching Duration
N/A
Report this resource to TPT
Reported resources will be reviewed by our team. Report this resource to let us know if this resource violates TPT’s content guidelines.
Standards
to see state-specific standards (only available in the US).
CCSS3.MD.A.1
Tell and write time to the nearest minute and measure time intervals in minutes. Solve word problems involving addition and subtraction of time intervals in minutes, e.g., by representing the problem on a number line diagram.
CCSS3.MD.A.2
Measure and estimate liquid volumes and masses of objects using standard units of grams (g), kilograms (kg), and liters (l). Add, subtract, multiply, or divide to solve one-step word problems involving masses or volumes that are given in the same units, e.g., by using drawings (such as a beaker with a measurement scale) to represent the problem.
CCSS3.MD.B.3
Draw a scaled picture graph and a scaled bar graph to represent a data set with several categories. Solve one- and two-step “how many more” and “how many less” problems using information presented in scaled bar graphs. For example, draw a bar graph in which each square in the bar graph might represent 5 pets.
CCSS3.MD.B.4
Generate measurement data by measuring lengths using rulers marked with halves and fourths of an inch. Show the data by making a line plot, where the horizontal scale is marked off in appropriate units-whole numbers, halves, or quarters.
CCSS3.MD.C.5
Recognize area as an attribute of plane figures and understand concepts of area measurement.


