Ecosystems (3rd grade Common Core & Next Generation Science Standards)
Teach Play Learn
1.4k Followers
Grade Levels
2nd - 4th, Homeschool
Subjects
Resource Type
Standards
CCSS3.MD.B.3
CCSS3.MD.B.4
CCSSRI.3.1
CCSSRI.3.3
CCSSSL.3.4
Formats Included
- PDF
Pages
158 pages
Teach Play Learn
1.4k Followers
Description
Interdependent Relationships in Ecosystems
Hands on fun! Play games, build models, investigate habitats, measure trees, study water pollution and meet standards.
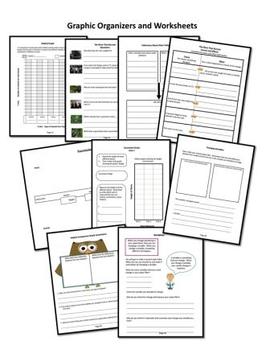
Student workbook is filled with reading activities, higher level questions, word flap books, graphic organizers and worksheets (61 pages).
Teacher’s edition contains eight complete lesson plans with background information and instructions for outdoor/sports court games and hands-on science activities.
Next Generation Science Standards:
LS2.C: Ecosystem Dynamics, Functioning & Resilience
LS4.C: Adaptation
ETS1.C: Optimizing the Design Solution
Analyzing and Interpreting Data, Engaging in Argument from Evidence, Cause and Effect, Scale, Proportion and Quantity, Systems and System Models, Science is a Human Endeavor
Plus: Common Core Math and ELA.
MP.2 Reason abstractly and quantitatively. (3-LS4-1),(3-LS4-4)
MP.4 Model with mathematics. (3-LS2-1),(3-LS4-1),(3-LS4-4)
MP.5 Use appropriate tools strategically. (3-LS4-1)
3.NBT Number and Operations in Base Ten (3-LS2-1)
3.MD.B.3 Draw a scaled picture graph and a scaled bar graph to represent a data set with several categories. Solve one- and two-step “how many more” and “how many less”
problems using information presented in scaled bar graphs. (3-LS4-3)
3.MD.B.4 Generate measurement data by measuring lengths using rulers marked with halves and fourths of an inch. Show the data by making a line plot, where the horizontal scale
is marked off in appropriate units—whole numbers, halves, or quarters. (3-LS4-1)
RI.3.1 Ask and answer questions to demonstrate understanding of a text, referring explicitly to the text as the basis for the answers. (3-LS2-1),(3-LS4-1),(3-LS4-3),(3-LS4-4)
RI.3.2 Determine the main idea of a text; recount the key details and explain how they support the main idea. (3-LS4-1),(3-LS4-3),(3LS4-4)
RI.3.3 Describe the relationship between a series of historical events, scientific ideas or concepts, or steps in technical procedures in a text, using language that pertains to time,
sequence, and cause/effect. (3-LS2-1),(3-LS4-1),(3-LS4-3),(3-LS4-4)
W.3.1 Write opinion pieces on topics or texts, supporting a point of view with reasons. (3-LS2-1),(3-LS4-1),(3-LS4-3),(3-LS4-4)
W.3.2 Write informative/explanatory texts to examine a topic and convey ideas and information clearly. (3-LS4-1),(3-LS4-3),(3-LS4-4)
W.3.9 Recall information from experiences or gather information from print and digital sources; take brief notes on sources and sort evidence into provided categories. (3-LS4-1)
SL.3.4 Report on a topic or text, tell a story, or recount an experience with appropriate facts and relevant, descriptive details, speaking clearly at an understandable pace. (3-LS4-
3),(3-LS4-4)
Key Words:
Teach Play Learn, Common Core, ELA, Math, Maths, science, project, inquiry, five E's, Next Generation Science Standards, NGSS, ELL, ELD, grade 3, third grade, grade three, elementary, primary, disciplinary core ideas, crosscutting concepts, engineering, science, hands on, literacy, mathematics, Five E's.
Total Pages
158 pages
Answer Key
Included
Teaching Duration
1 month
Report this resource to TPT
Reported resources will be reviewed by our team. Report this resource to let us know if this resource violates TPT’s content guidelines.
Standards
to see state-specific standards (only available in the US).
CCSS3.MD.B.3
Draw a scaled picture graph and a scaled bar graph to represent a data set with several categories. Solve one- and two-step “how many more” and “how many less” problems using information presented in scaled bar graphs. For example, draw a bar graph in which each square in the bar graph might represent 5 pets.
CCSS3.MD.B.4
Generate measurement data by measuring lengths using rulers marked with halves and fourths of an inch. Show the data by making a line plot, where the horizontal scale is marked off in appropriate units-whole numbers, halves, or quarters.
CCSSRI.3.1
Ask and answer questions to demonstrate understanding of a text, referring explicitly to the text as the basis for the answers.
CCSSRI.3.3
Describe the relationship between a series of historical events, scientific ideas or concepts, or steps in technical procedures in a text, using language that pertains to time, sequence, and cause/effect.
CCSSSL.3.4
Report on a topic or text, tell a story, or recount an experience with appropriate facts and relevant, descriptive details, speaking clearly at an understandable pace.


