Data and Statistics Terminology Posters - Math Vocabulary Classroom Display
- PDF
Also included in
- This set of Elementary Math Terminology Posters means you will never have to look up a Maths term again! Helping your students learn maths terminology is one of the most powerful things you can do to help them understand and succeed as maths learners. This GROWING bundle of Elementary Math Posters wPrice $24.99Original Price $51.15Save $26.16
- This Statistics and Probability Math Vocabulary Set includes posters to support your students in learning about terms used in Data, Statistics, Chance and Probability units. Including over 200 pages of math terminology and definitions in an easy to read format, including pictures! Perfect as a colouPrice $5.53Original Price $7.90Save $2.37
Description
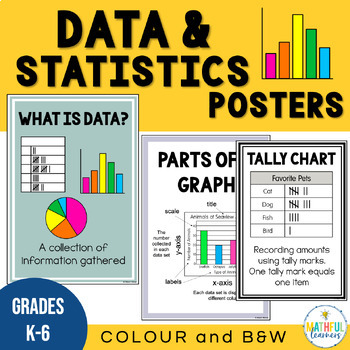
This Data and Statistics Math Vocabulary Classroom Display includes posters to support your students with their learning of Data and Statistics Terminology including definitions for types of graphs, interpreting graphs, as well as mode, mean and median. This resource includes 39 pages of definitions for data and statistics terms in an easy to read format, including pictures! Your students will be collecting, displaying, anaylsing and interpreting data like a pro in no time! Perfect as a colourful display or use directly onto your smartboard (IWB) for discussion points. Each poster is duplicated 3 times, full colour, colour and B&W.
What's included in this Data and Statistics Classroom Display:
Terms included in these data and statistic terminology posters:
- What is Data
- Collecting Data
- Sorting Data
- Displaying Data
- Interpreting Data
- How to Graph Data
- Tally Chart
- Strip Graph
- Picture Graph
- PIctogram
- Scatter Plot
- Line Graph
- Line Plot
- Bar Graph
- Column Graph
- Box and Whisker Plot
- Box Plot
- Pie Graph
- Pie Chart
- Circle Graph
- Range
- Mean
- Median
- Mode
- Parts of a Graph
- Compare
- Count
- Label
- List
- Most Common
- Least Common
- Most Popular
- Least Popular
- Sort
- Interpret
Please see the preview for more details.
Have I missed a term you use? Send me a note to followers and I will create it for you!
_____________________________________________
If these Data and Statistics Terminology Posters are the perfect fit for your classroom, you will also love these Math Posters:
⭐ A-Z Math Alphabet Posters (Total of 140 pages)
⭐ Place Value Posters ***FREE***
⭐ Fractions, Decimals and Percentages ***FREE***
⭐ Problem Solving Strategies Posters
⭐ Measurement - Weight and Mass Posters
⭐ Measurement - Volume and Capacity Posters
⭐ Measurement - Length Posters
⭐ Chance and Probability Posters
Get free TpT credits for future purchases!
If you like this resource, then I’d love to hear from you! Select “My Purchases”, choose ratings and leave feedback and you will receive free credits to be used on your next TpT purchase.
Want 50% off all new releases for the first 24 hours?
Follow Me so you are the first to know!
Thank you!
Let’s Connect
Follow me on Instagram, Facebook and visit my website Mathful Learners for more great tips to use in your classroom.
_____________________________________________
COPYRIGHT ©Alison Hislop of Mathful Learners
Permission for personal use in a single classroom. Please purchase additional licenses for use in multiple classrooms.


