Data and Graphing Worksheets - Bar Graphs, Picture Graphs & Tally Charts
- PDF
What educators are saying
Also included in
- This bundle of bar graph and picture graph activities includes fun and engaging lessons for your graphing unit! It includes graphing math centers, hands-on activities, journal prompts, math crafts, and more. These resources are perfect for small groups, math centers, or whole group reinforcement actPrice $19.50Original Price $26.75Save $7.25
- Ready to have your math planning done for the year?! This complete bundle of my 2nd grade math activities will get you through the entire year - it includes huge hands-on activity packs, journal prompts, enrichment menus, craftivities and much, much more! These activities will be easy to plug into yPrice $245.60Original Price $307.00Save $61.40
Description
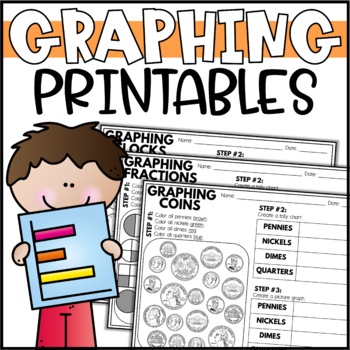
These graphing activities will challenge your students during your graphing unit! These data and graphing worksheets spiral other math skills at the same time and are perfect for enrichment during math centers.
Each 2-page worksheet centers on a different math topic:
•Identifying Coins
•Telling Time
•Identifying 3D Shapes
•Identifying 2D Shapes
•Odd/Even numbers, Greater Than/Less Than sign
• Fractions
Students will need to create a tally chart, a picture graph and a bar graph for each data set, and answer challenging questions about their data and graphs. These graphing activities are GREAT practice for students, and provide that extra challenge for students who need the extra graphing enrichment.
❗Save 20% by purchasing the Graphing Activity BUNDLE!
More resources for your Data & Graphing unit:
⭐ Data & Graphing Hands-On Activities
⭐ Data and Graphing Enrichment Activities - Math Menu, Choice Board


