
Data and Graphing Lessons | Partially Editable for French Translation


- Zip
Also included in
 This bundle of partially editable Differentiated Guided Math Lesson Plans is everything you need to teach math in small groups in French while the rest of your class works on independent centres! These differentiated lessons are perfect for use with my Guided Math Centres. ⭐ These guided math lessPrice $120.00Original Price $150.00Save $30.00
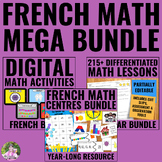 Your entire French Math program in one bundle! This full-year bundle of my French guided math centres and differentiated guided math lessons will engage Grade 2 and Grade 3 students in authentic, meaningful learning activities while you work with student groups! ⭐ This full-year math bundle containsPrice $267.00Original Price $345.00Save $78.00
Description
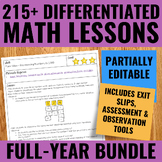
Looking for engaging data and graphing lessons to meet the needs of all your students? These differentiated lessons are perfect for small-group instruction while the rest of your students are engaged with Guided Math Centers. They are linked to the 2020 Ontario Mathematics Curriculum expectations.
⭐ These data and graphing lessons are part of a year-long bundle of over 215 differentiated lessons!
⚠️ All pages are in English. Student-facing pages are editable for your translation. ⚠️
This set of data and graphing lessons is perfect for:
✔ 2nd and 3rd-grade French classrooms
✔ Teachers who believe in hands-on learning
✔ Teachers who believe in differentiation and small-group instruction
✔ Teachers who want to limit photocopying in their day
✔ Teachers who don't want to prep math activities daily
Included in this set of data and graphing lessons are:
• 18 differentiated lessons (lesson pages are English only)
• assessment and observation pages (editable for translation)
• student exit slips (editable for translation)
• activity masters (editable for translation)
• printable manipulatives
• bonus activities (editable for translation)
⭐ These data and graphing lessons are aligned with the 2020 Ontario Mathematics Curriculum expectations.
❤️ Get a look at the layout of this resource by watching the preview video! (Note: English resources shown. Components are identical, but student-facing pages are editable.)
✅ Grab an entire year's worth of Differentiated Guided Math Lessons in the year-long BUNDLE!
✅ There is also a full year's worth of Guided Math Centres to engage your students while you teach these lessons available here!
⭐ Don't Miss Out!
Follow me to be the first to know about my new products and freebies!
Leave feedback on this item to earn credit toward future TpT purchases!
I value your feedback greatly! It gives me the information I need to continue creating high-quality products for your classroom!
⭐ Feel free to e-mail me with any questions about this product at: questions@mrsbeattiesclassroom.com.
Connect with me for classroom ideas & resources, freebies, and more product details at any or all of the links below!
Join My Email List for FREEBIES and great teaching ideas!
This product by Erin Beattie - Mrs. Beattie's Classroom is copyrighted for single-classroom use only. This product may not be resold and can be copied for personal use within a classroom only. If you have questions, please email questions@mrsbeattiesclassroom.com
Copyright © Erin Beattie - Mrs. Beattie's Classroom
