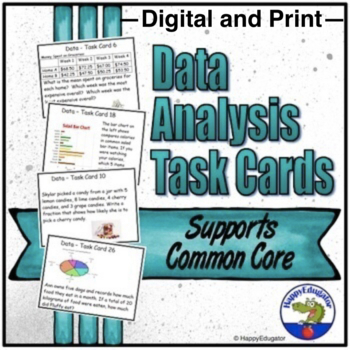
Data Analysis Task Cards Math Test Prep - Easel Activity Digital and Print
- PDF
- Easel Activity
What educators are saying
Description
Data Analysis Task Cards. 30 task cards on data collection and data analysis, answer recording sheet, and answer key. Great for math test prep. Print or digital. Tasks includes finding range, median, mode and mean of a set of data, creating pictographs, interpreting line plots, stem and leaf plots, bar graphs, circle graphs, box and whisker plots, probability, random and biased samples.
Digital and Print: Includes an Easel Activity ready for learning with digital tools. Assign it online in Google Classroom or use a link in any LMS. Select the pages you want and add your own directions or notes. Helpful for remote teaching. Access on the product page after purchase. 20 total pages including 8 digital pages. Please see full preview.
You may also like:
Supports Common Core State Standards.
CCSS.Math.Content.6.SP.B.4 Display numerical data in plots on a number line, including dot plots, histograms, and box plots.
CCSS.Math.Content.6.SP.B.5 Summarize numerical data sets in relation to their context, such as by:
CCSS.Math.Content.6.SP.B.5a Reporting the number of observations.
CCSS.Math.Content.6.SP.B.5b Describing the nature of the attribute under investigation, including how it was measured and its units of measurement.
CCSS.Math.Content.6.SP.B.5c Giving quantitative measures of center (median and/or mean) and variability (interquartile range and/or mean absolute deviation), as well as describing any overall pattern and any striking deviations from the overall pattern with reference to the context in which the data were gathered.
CCSS.Math.Content.6.SP.B.5d Relating the choice of measures of center and variability to the shape of the data distribution and the context in which the data were gathered.
CCSS.Math.Content.6.SP.A.2 Understand that a set of data collected to answer a statistical question has a distribution which can be described by its center, spread, and overall shape.
CCSS.Math.Content.6.SP.A.3 Recognize that a measure of center for a numerical data set summarizes all of its values with a single number, while a measure of variation describes how its values vary with a single number.
CCSS.Math.Content.7.SP.B.3 Informally assess the degree of visual overlap of two numerical data distributions with similar variabilities, measuring the difference between the centers by expressing it as a multiple of a measure of variability.
Follow me HERE to get notified of updates, sales, free resources, and new products. All new products are 50% off for 48 hours.
© Deborah Hayes aka HappyEdugator. For classroom and homeschool use. Your purchase buys one license. You may purchase extra licenses at a discount.


