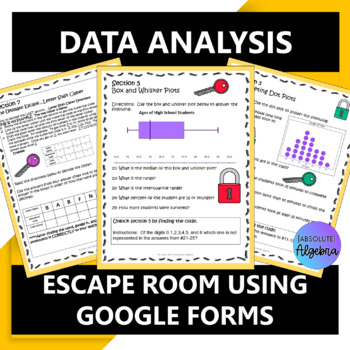
Data Analysis Digital Digital Escape Room using Google Forms
- PDF
- Google Apps™
- Internet Activities

What educators are saying
Also included in
- Middle School Math Activities BundleThis Middle School Math Activities Bundle contains 44 products full of fun math activities like games, puzzles, and worksheets designed to engage and motivate your middle school students. Resources include digital escape rooms, mazes, game show activities, scavengPrice $116.60Original Price $145.75Save $29.15
- Middle School Math Digital Escape Room Bundle using Google FormsEngage and motivate your students with this comprehensive bundle of 10 Google Form escape rooms. From integers, multiplying and dividing decimals and fractions, percents to decimals to fractions, data analysis, solving equations and morPrice $40.40Original Price $50.50Save $10.10
- Data Analysis Bundle Dot Box and Stem and Leaf Plots Histograms and More!Engage and motivate your students with this comprehensive data analysis bundle including box and whisker plots, dot plots, stem and leaf plots, histograms, relative frequency tables, percent bar graphs, and more. This bundle iPrice $20.00Original Price $25.00Save $5.00
Description
#overtherainbow Data Analysis Digital Escape Room Google Forms
Give your students comprehensive practice on data analysis including variability, mean, median, mode, range, IQR, box and whisker, dot, stem and leaf plots, histograms, relative frequency tables, and more! This is a NO PREP Escape Room using technology! Just hand your students the worksheet, give them URL for the google form and they're ready to go!
This resource includes:
- Variability
- Mean, Median, Mode, Range, and Interquartile Range (IQR)
- Dot Plots
- Stem and Leaf Plots
- Histograms
- Box and Whisker Plots
- Relative Frequency Tables
- Teacher Instructions
- Google Form URL for students to enter their codes
- Answer Sheet
- Answer Key
To get a better look at this resource take a look at the preview!
Check out even MORE middle school activities below!
- Interpreting Box and Whisker Plots Color by Number Activity
- Mean, Median, Mode, Range, and IQR Data and Graphs Activity
- Interpreting Histograms Color by Number Activity
- Integer Review Google Form Escape Room
- Multiplying and Dividing Decimals and Fractions Google Form Escape Room
- Converting Fractions, Decimals, and Percents Google Form Escape Room
- Prime Factorization with Exponents and Notes: Scrambled Answers Activity
- Solving Proportion Word Problems: Review Around Activity
- Word Problems: Multiplying and Dividing Decimals Scavenger Hunt Activity
- Dividing: Tarsia Puzzle OR Matching Activity
- Multiplying and Dividing Fractions with Notes: Error Analysis
- Multiplying Fractions with Notes: Follow the Path Activity
- Integer Operations with Notes: Mystery Number Puzzles
- Everything Integers!
- Factors VS Multiples: $100,000 Pyramid Game
- Multiplying Decimals: Triangle Mazes Activity
- Translating Verbal to Algebraic Expressions, Equations, and Inequalities with Notes: Matching Activity
- Order of Operations with Positive and Negative Integers: Triangle Mazes Activity
- Solving One and Two-Step Inequalities: Triangle Mazes Activity
- Multiplying and Dividing Fraction Word Problems: Scrambled Answers Activity
- Solving One and Two-Step Equations: Find the Pattern Activity
Customer Tips:
How do I get TpT credit for future purchases?
Go to your "My Purchases" page. Next to each purchase, you'll see a "Provide Feedback" button. Simply click it and you will be taken to a page where you can give a quick rating and leave a short comment for the product. Each time you give feedback, TpT gives you feedback credits that you may use to lower the cost of your future purchases.
Contact me at suzy.mahoney@absolutealgebra.com with any questions!
Thank you,
|Absolute| Algebra ©


