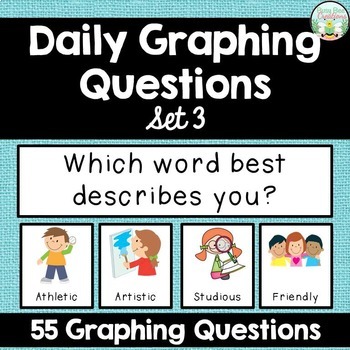
Daily Graphing Questions - Set 3
- Zip
Also included in
- Save money by buying the bundle!! You get set 1, set 2. and set 3 for a total of 195 questions! Use one for everyday of the school year!Making data collection part of your daily routine is easy with these 195 graphing cards. Students will take a genuine interest because they will get to cast theirPrice $17.50Original Price $21.00Save $3.50
Description
This is set 3 of my Daily Graphing Questions. With 55 questions to choose from students will get to cast their vote on a regular basis to a variety of kid friendly questions. Each survey question comes with 2-4 picture choices making it easy for you to differentiate according to the needs of your students.
The graphing questions and choices are designed to fit in a rectangular pocket chart (approximately 12 x 30 – chart not included), but could also be displayed just as easily on a board using magnetic tape. The students cast their vote by placing a small colored rectangle above their choice. Check out the picture in the preview to see exactly what I mean.
Choose a question from the 55 different graphing questions included. Display the question and choices either on the board or in a pocket chart. Each day, choose 5-10 students to cast their votes and then interpret the results as a class. Because new students get to cast their votes each day, the graph is constantly changing and can be reinterpreted every day. To create the opportunity for higher level questioning, have your boys cast their vote using a different color than the girls. Once everyone has had a chance to vote, it’s time to choose a new question!
I have also included a printable graphing worksheet that can be used in conjunction with these cards. The worksheet is designed to be used with any of the graphing questions and requires that the students use the data collected by their classmates to create a tally chart, a bar graph, a picture graph and then finally to use their math thinking to write about their graphs and the data that was collected. This is a great way to occasionally assess the students' understanding.
Here are some of the graphing questions included in this packet.
Are you good at keeping secrets?
Which type of music do you prefer?
Which kind of cookie is your favorite?
Which would you rather do in the snow?
Which Valentine’s gift is the best?
What is your favorite way to eat potatoes?
Which would you rather visit?
What is your favorite way to eat eggs?
Which name is the best name for a puppy?
Are you right handed or left handed?
Have you ever been horseback riding?
Which shell do you think is the prettiest?
What do you like to do at the beach?
Which popcorn topping is your favorite?
Where would you rather live?
Which would you rather find in your Easter basket?
Which desert animal would you like to research?
Which would you rather drive?
Would you like to ride in a hot air balloon?
What is your favorite way to eat chocolate?
Would you like to be President one day?
Which word best describes you?
And many more!
A blank template is also included so that you can create your own questions!
Download the preview for a closer look!
Check out my other graphing sets by clicking on the links below.
Check out Daily Graphing Questions - Set 1 by clicking here
Check put Daily Graphing Questions - Set 2 by clicking here.
Check out my Daily Graphing Questions Bundle by clicking here.
Do you need the Spanish Versions? Click on the links below to check them out.
Do you need UK English spellings? Click on the links below.
Thanks for looking!
***************************************************************************************************************************************************
It pays to become a follower! All new resources are discounted 50% off for the first 48 hours. Just look for the green start at the top of the page next to my store logo and click on it to become a follower. When you do this you will receive email updates and information about upcoming sales and new products!
Have Questions? If you have any questions about this product, please feel free to send me an email at abusybeecreations@gmail.com. I am always happy to help!
Want to see more? Follow me on Pinterest!
© Busy Bee Creations – This product is intended for single classroom and personal use only.


