DIGITAL TRACKER for Formative Assessments ANY Subject and ANY Grade!
- PDF
What educators are saying
Description
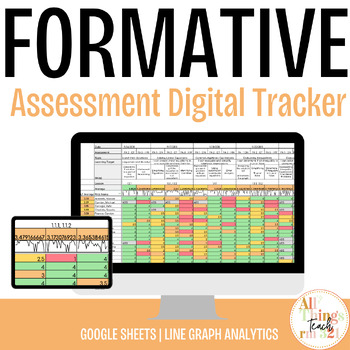
This is a Digital Formative Assessment Tracker that can be used to collect formative assessment data daily! It can be used in for ANY subject and ANY grade. The great thing about it is that it saves you so much time especially if you are using a mobile device like an iPad or Surface as you are tracking students! It is also very easy to use! I have done the hard part for you--all of the coding and formatting is nothing you need to worry about. Just enter in your data, and watch the cells change colors and also the line graphs will calculate immediately! I have shared this file with science teachers, middle school teachers, and even principals at other schools, etc. It is a game changer!
Please note, this tracker must be used by importing the downloaded file into Google Sheets. If you try to use Microsoft Excel, the formatted cells will not be displayed or function correctly.
All of the directions for how to use this tracker are in the spreadsheet on the first tab. When you download this file, you will notice three tabs. The first one is a page full of directions. Read them carefully. There are two rows and one column on the Google sheet that you must not touch. Those rows calculate your data for you. The rest of the directions will help you understand how to set up your own tracker. It is a very quick process. The second tab shows you an example of my own tracker for a Unit in Algebra. The third tab is a blank tracker that is already formatted and ready to go! All you need to do is start tracking and entering in data! This tracker has taken a long time to create! The best part of the tool has been the line graph that automatically creates once you start entering in data! I hope you enjoy this resources as much as I do!
In the video preview, I am just showing you how you enter in a score, and the conditional format color codes for you. Also, notice how the averages change at the top and on the left and the line graph also changes shape!
If you have any questions, please don’t hesitate to ask me!
Let’s connect! Find me on Instagram to watch me teach and see how I put my resources into action!
TERMS OF USE:
If purchased, you are agreeing that the contents are property of All Things Teach Rm 321 and licensed to you only for classroom/personal use as a single user. I retain the copyright, and reserve all rights to this product.
~All Things Teach Rm 321


