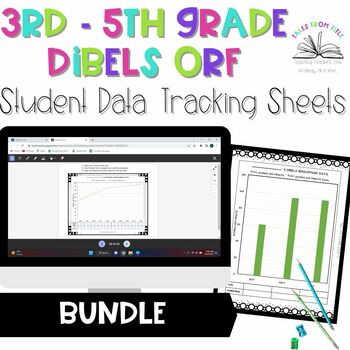
DIBELS ORF Student Data Tracking Sheets 3 - 5 Print & Digital
- Zip
- Easel Activity
Products in this Bundle (3)
Also included in
- Make student data tracking and goal setting easy with the 3rd – 5th Grade DIBELS ORF and Reading Accuracy data tracking sheets. This DIBELS ORF and Reading Accuracy data tracking bundle allows students to track their benchmark and progress monitoring data. After reading, they can complete the post-rPrice $25.12Original Price $31.40Save $6.28
Description
Make student data tracking and goal setting easy with the 3rd – 5th Grade DIBELS ORF data tracking sheets. This DIBELS ORF data tracking bundle allows students to track their benchmark and progress monitoring data. After reading, they can complete the post-reading reflection and/or set an oral reading fluency goal using the goal setting sheet.
This set is the perfect way to get students thinking critically about their reading and how they can grow as a reader. It is a comprehensive set with a variety of line and bar graph options (bar graphs only available in the 3rd and 4th grade set). They were created using the DIBELS 8th Edition cut points and have multiple trendline options so all students have a graph that meets their unique needs. I even included a blank graph for those students who might need their own trendline because their needs fall outside the parameters of the DIBELS cut points.
This set is a perfect addition to your student data/leadership binders and they make a great talking point for student led conferences.
This version is the digital & printable version, but it is also available as a digital only and printable only. You can check them out here.
What's Included:
✨ 191 pages of printable and digital graph options and directions for use:
✨ 3rd Grade DIBELS ORF Student Data Tracking Sheets: Digital & Printable Options (74 pages of graphs and directions)
✨ 4th Grade DIBELS ORF Student Data Tracking Sheets: Digital & Printable Options (74 pages of graphs and directions)
✨ 5th Grade DIBELS ORF Student Data Tracking Sheets Digital & Printable Options (43 pages of graphs and directions)
You might also be interested in these other products:
⭐ DIBELS ORF Student Data Tracking Sheets: 3rd Grade Print & Digital
⭐ DIBELS ORF Student Data Tracking Sheets: 5th Grade Print & Digital
⭐ DIBELS ORF Student Data Tracking Print & Digital: 4th Grade
Also, clickhere to follow me and be notified when new products are posted and go on sale! Remember, all new products are discounted for the first 48 hours they are listed!
Copyright © Tales from Title
Permission to copy for single classroom use only.
Please purchase additional licenses if you intend to share this product.
This product is for personal use only and may not be resold as your own.
If you have any questions or suggestions to make this product better, reach out to me at talesfromtitle@gmail.com.
Please leave feedback, comments, and give my store a follow if you find my resources helpful in your classroom.
Connect with me!
⭐ YouTube


