Coral Reef Informational Text
Classroom Helper - Success through Education
152 Followers
Grade Levels
3rd
Subjects
Resource Type
Standards
CCSS3.MD.B.3
CCSSRI.3.1
NGSS3-LS2-1
Formats Included
- Zip
Pages
27 pages
Classroom Helper - Success through Education
152 Followers
Also included in
- Grade 1 Math Task CardsThis set includes PowerPoint slides that address:Operations and Algebraic Thinking (CCSS.1.OA.A.1 to CCSS.1.OA.D.8)Number and Operations in Base Ten (CCSS.1.NBT.A.1 to CCSS.1.NBT.C.6)Measurements and Data (CCSS.1.MD.A.1 to CCSS.1.MD.C.4)Geometry (CCSS.1.G.A.1 to CCSS.1.G.A.3)GPrice $59.64Original Price $71.75Save $12.11
Description
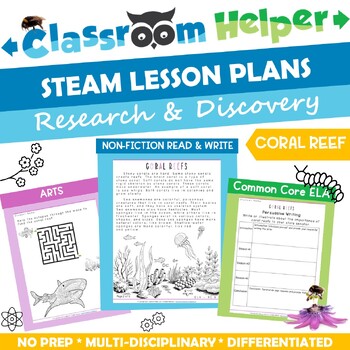
Coral Reef Lesson Plan introduces students to the coral reef ecosystem and the marine life that depend on these reefs for survival.
Coral Reefs lesson plan teaches life science in the coral reef. Students will learn about the importance of coral reefs and the marine life that depend on coral reefs.
Activities provided:
► Individual Work, Partner, and Class Work.
► Formative assessments.
► Summative assessments.
Focus Areas and Standards covered:
► English Language Arts (ELA – RI.3.1).
► Mathematics (3.MD.B.3).
► Science (3-LS2-1).
► Social Studies (SSS1.3.1).
Table of Contents
- Family Newsletter
- Resources for Families
- Educator Resource
- Classroom Resources
- Mindfulness Activity for Students
- Daily Reading Log
- Coral Reef Info Text
- Coral Reef Info Text - Student Responses
- Math - Coral Reef Data
- Persuasive Writing
- Instructions
- Writing Organizer
- Student Response
- Fast Finishers Activities
- Answer Sheets
- Certificate of Completion
- Terms of Use and Credits Page
©Copyright 2023 Classroom Helper, Inc – All Rights Reserved.
To receive updates on new products, follow us on TpT.
Total Pages
27 pages
Answer Key
Included
Teaching Duration
90 minutes
Report this resource to TPT
Reported resources will be reviewed by our team. Report this resource to let us know if this resource violates TPT’s content guidelines.
Standards
to see state-specific standards (only available in the US).
CCSS3.MD.B.3
Draw a scaled picture graph and a scaled bar graph to represent a data set with several categories. Solve one- and two-step “how many more” and “how many less” problems using information presented in scaled bar graphs. For example, draw a bar graph in which each square in the bar graph might represent 5 pets.
CCSSRI.3.1
Ask and answer questions to demonstrate understanding of a text, referring explicitly to the text as the basis for the answers.
NGSS3-LS2-1
Construct an argument that some animals form groups that help members survive.


