Common Core Math 1 Linear Regression Unit (notes, ws, test review, and test)
- PDF
Description
5 DAYS WORTH OF LESSON PLANS! 3 DAYS OF NOTES/WORKSHEETS AND A TEST REVIEW AND TEST!
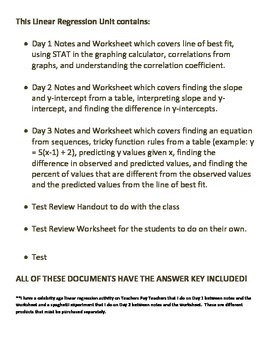
This Linear Regression Unit contains:
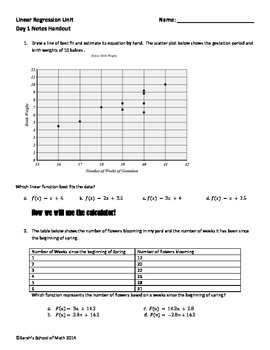
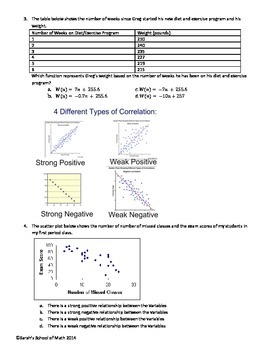
• Day 1 Notes and Worksheet which covers line of best fit, using STAT in the graphing calculator, correlations from graphs, and understanding the correlation coefficient.
• Day 2 Notes and Worksheet which covers finding the slope and y-intercept from a table, interpreting slope and y-intercept, and finding the difference in y-intercepts.
• Day 3 Notes and Worksheet which covers finding an equation from sequences, tricky function rules from a table (example: y = 5(x-1) + 2), predicting y values given x, finding the difference in observed and predicted values, and finding the percent of values that are different from the observed values and the predicted values from the line of best fit.
• Test Review Handout to do with the class
• Test Review Worksheet for the students to do on their own.
• Test
ALL OF THESE DOCUMENTS HAVE THE ANSWER KEY INCLUDED!
Want activities on linear regression? Check out:
Link-Linear Regression Celebrity Age Activity
Link-Linear Regression Spaghetti Experiment
Want to buy just a few of these unit resources individually? Check out:
Link-Linear Regression and Correlation Notes and Worksheet
Link-Linear Regression Interpreting Slope and y-intercept Notes and Worksheet
Link-Linear Regression Prediction Problems Student Notes and Worksheet


