Climate Change Activity Mapping Carbon Emissions NGSS MS-ESS3-5 ESS3-4
Flying Colors Science
4.8k Followers
Grade Levels
7th - 10th
Subjects
Resource Type
Standards
NGSSMS-ESS3-5
NGSSMS-ESS3-4
NGSSHS-ESS3-5
NGSSHS-ESS3-4
Formats Included
- PDF
Pages
7 pages
Flying Colors Science
4.8k Followers
What educators are saying
Thanks to the paid materials, my students now view learning as an exciting adventure filled with endless possibilities. That's the power of creativity!
Loved that students used data to color code the map. Fun way to use data. Increased student engagement.
Also included in
- SAVE MORE THAN 30% on this bundle PACKED with high-quality, rigorous climate change activities that are NO PREP and EASY TO IMPLEMENT. This activity bundle has a little bit of everything! Resources Included:Two Truths and a Lie Critical Thinking ActivityClimate Read and Respond CER ActivityAnalyzePrice $16.99Original Price $24.46Save $7.47
- Never search for "something to do tomorrow" ever again! This bundle contains PRINT AND GO lessons, NO PREP activities, LOW PREP labs, and ENGAGING articles to supplement and thoroughly enhance an Earth and space science course. Every included resource is easy to implement, standards-based, and high-Price $399.99Original Price $639.06Save $239.07
- SAVE 35% off list prices! Engage students with CRITICAL THINKING as you teach them about how humans have impacted ecosystems around the world. The 12 included resources provide fun, NGSS-based activities for each of the following topics:Habitat Destruction Overharvested ResourcesInvasive SpeciesWatPrice $39.99Original Price $62.90Save $22.91
- SAVE OVER 45%! This climate change unit is engaging, data-driven, and provides a large variety of activities and assessments. EVERYTHING YOU NEED TO TEACH A COMPREHENSIVE CLIMATE CHANGE UNIT IS INCLUDED. All of the work has been done for you - from start to finish! Reflect the rigor of NGSS witPrice $39.99Original Price $74.85Save $34.86
Description
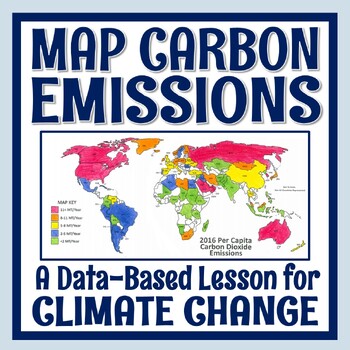
Students use real data to color-code a map of 68 countries based on their per capita carbon emissions. In this activity, students will:
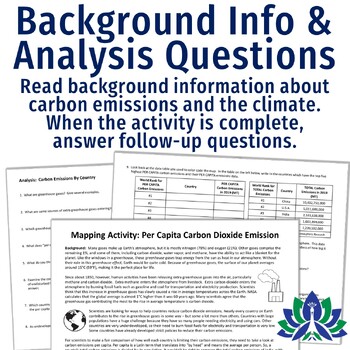
- READ a 1-page article about greenhouse gases, carbon dioxide, what per capita means, and the activity directions.
- CONSTRUCT a World Map by attaching 2 provided pages (it's easy!).
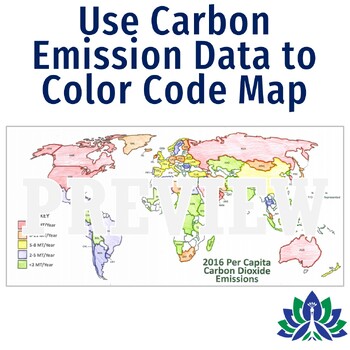
- COLOR CODE countries on the map according to their per capita carbon emissions.
- ANSWER 11 analysis questions focusing on the greenhouse effect, sources of carbon emissions, and how developed countries compared to underdeveloped countries.
⭐Get this activity at a steep discount in our Climate Change Activities Bundle!
Related Standards:
- NGSS MS-ESS3-5: Ask questions to clarify evidence of the factors that have caused the rise in global temperatures over the past century.
- NGSS MS-ESS3-4: Construct an argument supported by evidence for how increases in human population and per-capita consumption of natural resources impact Earth's systems.
- NGSS Science & Engineering Practice: Analyzing and interpreting data
Teacher Notes:
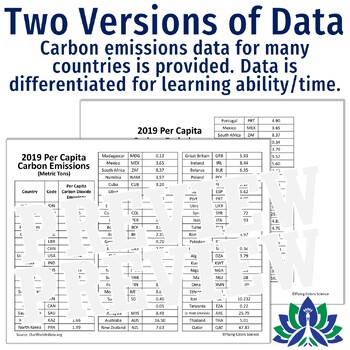
- To make differentiation easier, an abbreviated data set is provided, as well. The countries on the abbreviated data table still provide a good global picture but with a decreased workload.
- The World Map is very easily printable. It comes as two 8.5 x 11 printable pages and very, very simple instructions on how to match them up.
- While this activity is intended for a middle school audience, it would also be appropriate for high school students in their study of NGSS HS-ESS3-5.
- INCLUDES ANSWER KEY.
- Please note: This resource is NOT editable.
- SAVE $$ - Check out our Climate Change ACTIVITIES BUNDLE!
⭐⭐⭐ Click here to get 5 FREE EARTH & SPACE SCIENCE lessons! ⭐⭐⭐
Total Pages
7 pages
Answer Key
Included
Teaching Duration
N/A
Report this resource to TPT
Reported resources will be reviewed by our team. Report this resource to let us know if this resource violates TPT’s content guidelines.
Standards
to see state-specific standards (only available in the US).
NGSSMS-ESS3-5
Ask questions to clarify evidence of the factors that have caused the rise in global temperatures over the past century. Examples of factors include human activities (such as fossil fuel combustion, cement production, and agricultural activity) and natural processes (such as changes in incoming solar radiation or volcanic activity). Examples of evidence can include tables, graphs, and maps of global and regional temperatures, atmospheric levels of gases such as carbon dioxide and methane, and the rates of human activities. Emphasis is on the major role that human activities play in causing the rise in global temperatures.
NGSSMS-ESS3-4
Construct an argument supported by evidence for how increases in human population and per-capita consumption of natural resources impact Earth’s systems. Examples of evidence include grade-appropriate databases on human populations and the rates of consumption of food and natural resources (such as freshwater, mineral, and energy). Examples of impacts can include changes to the appearance, composition, and structure of Earth’s systems as well as the rates at which they change. The consequences of increases in human populations and consumption of natural resources are described by science, but science does not make the decisions for the actions society takes.
NGSSHS-ESS3-5
Analyze geoscience data and the results from global climate models to make an evidence-based forecast of the current rate of global or regional climate change and associated future impacts to Earth's systems. Examples of evidence, for both data and climate model outputs, are for climate changes (such as precipitation and temperature) and their associated impacts (such as on sea level, glacial ice volumes, or atmosphere and ocean composition). Assessment is limited to one example of a climate change and its associated impacts.
NGSSHS-ESS3-4
Evaluate or refine a technological solution that reduces impacts of human activities on natural systems. Examples of data on the impacts of human activities could include the quantities and types of pollutants released, changes to biomass and species diversity, or areal changes in land surface use (such as for urban development, agriculture and livestock, or surface mining). Examples for limiting future impacts could range from local efforts (such as reducing, reusing, and recycling resources) to large-scale geoengineering design solutions (such as altering global temperatures by making large changes to the atmosphere or ocean).

