Chicago Neighborhood Graphing Project
Michael Alexandris
8 Followers
Resource Type
Standards
CCSS8.EE.C.8a
CCSS8.EE.C.8b
CCSS8.EE.C.8c
CCSSHSA-REI.D.10
CCSSHSA-REI.D.11
Formats Included
- Zip
Pages
9 pages
Michael Alexandris
8 Followers
Description
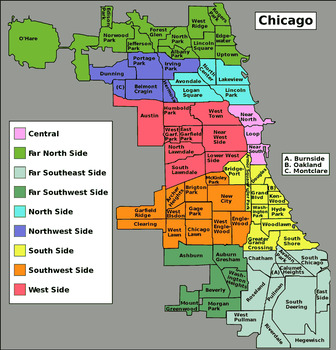
This project combines student knowledge of linear inequalities with their pride of representing their neighborhood! Using different neighborhood maps of Chicago, students will create a coordinate plane and plot their house on the map. I used this with my freshmen algebra class and it was overwhelmingly engaging!
Regions included:
Far North Side
North Side
Northwest Side
Central Chicago
South Side
Far Southeast Side
Far Southwest Side
West Side
Rubric included!!!
***Template to use with map of your choice***
Total Pages
9 pages
Answer Key
N/A
Teaching Duration
2 days
Report this resource to TPT
Reported resources will be reviewed by our team. Report this resource to let us know if this resource violates TPT’s content guidelines.
Standards
to see state-specific standards (only available in the US).
CCSS8.EE.C.8a
Understand that solutions to a system of two linear equations in two variables correspond to points of intersection of their graphs, because points of intersection satisfy both equations simultaneously.
CCSS8.EE.C.8b
Solve systems of two linear equations in two variables algebraically, and estimate solutions by graphing the equations. Solve simple cases by inspection. For example, 3𝘹 + 2𝘺 = 5 and 3𝘹 + 2𝘺 = 6 have no solution because 3𝘹 + 2𝘺 cannot simultaneously be 5 and 6.
CCSS8.EE.C.8c
Solve real-world and mathematical problems leading to two linear equations in two variables. For example, given coordinates for two pairs of points, determine whether the line through the first pair of points intersects the line through the second pair.
CCSSHSA-REI.D.10
Understand that the graph of an equation in two variables is the set of all its solutions plotted in the coordinate plane, often forming a curve (which could be a line).
CCSSHSA-REI.D.11
Explain why the 𝘹-coordinates of the points where the graphs of the equations 𝘺 = 𝘧(𝘹) and 𝘺 = 𝑔(𝘹) intersect are the solutions of the equation 𝘧(𝘹) = 𝑔(𝘹); find the solutions approximately, e.g., using technology to graph the functions, make tables of values, or find successive approximations. Include cases where 𝘧(𝘹) and/or 𝑔(𝘹) are linear, polynomial, rational, absolute value, exponential, and logarithmic functions.


