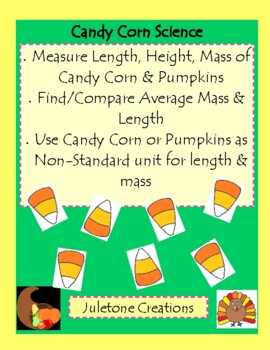
Candy Corn Science
Julie Klettke
6 Followers
Grade Levels
K - 5th
Subjects
Resource Type
Standards
CCSS2.MD.A.3
CCSS2.MD.D.9
CCSS2.MD.D.10
CCSS3.MD.A.2
CCSS3.MD.B.3
Formats Included
- PDF
Pages
31 pages
Julie Klettke
6 Followers
Description
Engage your students in several fun, fall-themed lessons. Resource is easy to copy and ready to use for whole class instruction, small group activity, or in math/science centers. A variety of skills and levels are included in this resource; measuring mass and length with non-standard units, measuring with standard units, averaging length and mass, comparing results to other students, and creating bar graphs. Follow-up questions accompany many of the measuring activities, requiring the use of critical thinking skills such as evaluation and analysis.
Total Pages
31 pages
Answer Key
N/A
Teaching Duration
N/A
Report this resource to TPT
Reported resources will be reviewed by our team. Report this resource to let us know if this resource violates TPT’s content guidelines.
Standards
to see state-specific standards (only available in the US).
CCSS2.MD.A.3
Estimate lengths using units of inches, feet, centimeters, and meters.
CCSS2.MD.D.9
Generate measurement data by measuring lengths of several objects to the nearest whole unit, or by making repeated measurements of the same object. Show the measurements by making a line plot, where the horizontal scale is marked off in whole-number units.
CCSS2.MD.D.10
Draw a picture graph and a bar graph (with single-unit scale) to represent a data set with up to four categories. Solve simple put-together, take-apart, and compare problems using information presented in a bar graph.
CCSS3.MD.A.2
Measure and estimate liquid volumes and masses of objects using standard units of grams (g), kilograms (kg), and liters (l). Add, subtract, multiply, or divide to solve one-step word problems involving masses or volumes that are given in the same units, e.g., by using drawings (such as a beaker with a measurement scale) to represent the problem.
CCSS3.MD.B.3
Draw a scaled picture graph and a scaled bar graph to represent a data set with several categories. Solve one- and two-step “how many more” and “how many less” problems using information presented in scaled bar graphs. For example, draw a bar graph in which each square in the bar graph might represent 5 pets.


