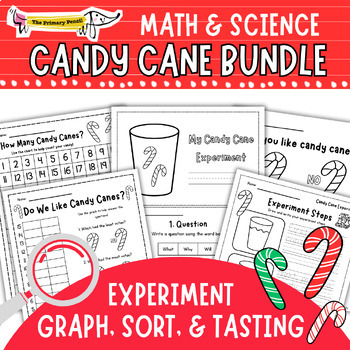
Candy Cane Math & Science Activity Bundle | Christmas Hands-On Learning!
The Primary Pencil
457 Followers
Grade Levels
K - 2nd
Subjects
Resource Type
Standards
CCSSK.CC.A.1
CCSSK.CC.B.5
CCSSK.MD.B.3
CCSS1.MD.C.4
CCSS2.MD.D.10
Formats Included
- Zip
Pages
60+
The Primary Pencil
457 Followers
What educators are saying
Such a fun activity. My students loved predicting what would happen and then observing the candy canes. Thanks!
Products in this Bundle (4)
Description
Math, Science, Candy Canes, and Christmas - What student wouldn't LOVE be engaged? Try out The Primary Pencil's Candy Cane Math & Science Activity Bundle! Created for young learners in K-2, this December resource offers hands-on and interactive lesson plans that combine sensory experiences, scientific investigations, and foundational math skills. Perfect addition to your winter themed learning or holiday party!
Product Bundle Features:
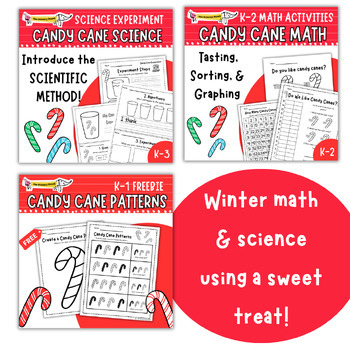
- Candy Cane Science Experiment: This resource guides children through the scientific process, from formulating hypotheses to conducting experiments and drawing conclusions while exploring candy canes!
- Candy Cane Taste, Graph, & Sort| K-2 Winter Math Snack Activities: This resource offers a hands-on and interactive lesson plan that combines sensory experiences with foundational math and graphing skills
- FREE Candy Cane Patterns: Three math worksheets where students finish the candy cane pattern or create their own creative pattern!
Total Pages
60+
Answer Key
N/A
Teaching Duration
N/A
Report this resource to TPT
Reported resources will be reviewed by our team. Report this resource to let us know if this resource violates TPT’s content guidelines.
Standards
to see state-specific standards (only available in the US).
CCSSK.CC.A.1
Count to 100 by ones and by tens.
CCSSK.CC.B.5
Count to answer “how many?” questions about as many as 20 things arranged in a line, a rectangular array, or a circle, or as many as 10 things in a scattered configuration; given a number from 1-20, count out that many objects.
CCSSK.MD.B.3
Classify objects into given categories; count the numbers of objects in each category and sort the categories by count.
CCSS1.MD.C.4
Organize, represent, and interpret data with up to three categories; ask and answer questions about the total number of data points, how many in each category, and how many more or less are in one category than in another.
CCSS2.MD.D.10
Draw a picture graph and a bar graph (with single-unit scale) to represent a data set with up to four categories. Solve simple put-together, take-apart, and compare problems using information presented in a bar graph.


