
Bundle: Look at Your Data! Activities (Dot Plots, Histograms, Boxplots)


- Zip
- Google Apps™

Products in this Bundle (8)
showing 1-5 of 8 products
Also included in
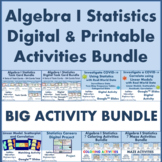 This BIG bundle includes multiple printable and digital statistics activities aligned with Common Core standards typically covered in Algebra 1. Students practice solving problems on measurement, count, quantitative, and categorical data in these activities. Students use both computation and contextPrice $42.99Original Price $61.60Save $18.61
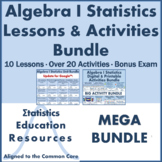 This MEGA bundle includes 10 Common Core Aligned lessons, 4 statistics vocabulary lists (1 master list for the whole unit, and 3 smaller unit “sub lists”), 1 mid-unit integrated mini-review and worksheet (as homework or a quiz!), and 1 exam with answer key, and over 20 printable and digital statistiPrice $65.99Original Price $102.35Save $36.36
Description
This bundle includes multiple printable and digital statistics activities on dot plots, histograms, and box plots aligned with Common Core standards. Students practice solving problems on measurement and count data in these activities. Students use both computation and contextual interpretation to solve problems. Problems range from introductory to challenging to support differentiation and scaffolding.
These activities are great for subs, independent work, early finishers, exam review, and extra practice.
Answer keys included!
Bundle Bonuses:
We’re offering the bundle at a discount of almost 30% off of the a la carte price.
This Look at Your Data! Statistics Activities Bundle materials cover the following topics:
Box plots; dot plots; histograms; interquartile range; median; outliers
Common Core Standards:
HSS.ID.A.1: Represent data with plots on the real number line (dot plots, histograms, box plots).
About this product:
Each activity includes a worksheet and detailed answer key in separate *.PDF files.
This purchase is to be used by one teacher only for classroom use. These materials may not be shared without purchasing the appropriate number of licenses. With the exception of remote learning, these materials may not be uploaded to the internet in any form (classroom websites, personal websites, or network drives, etc.).
Prefer to purchase statistics activities a la carte? Each resource can be found here:
Look at your Data! Task Cards (Common Core Aligned)
Look at Your Data!: Dot Plot Coloring Activity (Common Core Aligned)
Look at Your Data!: Histograms Coloring Activity (Common Core Aligned)
Look at Your Data!: Box Plots Coloring Activity (Common Core Aligned)
Look at Your Data!: Dot Plot Maze Activity (Common Core)
Look at Your Data!: Histogram Maze Activity (Common Core)
Look at Your Data!: Box Plot Maze Activity (Common Core)
Additional Tips:
Follow Statistics Education Resources on Pinterest!
Want to earn TeachersPayTeachers credit for discounts on future purchases?
1) Login and visit your ‘My Purchases’ page
2) Click the ‘Provide Feedback’ button.
3) Leave a rating and quick comment.
4) Your feedback will help in creating future products for the teaching community.
Want to be first to learn more about Statistics Education Resources products?
1) Look for the green star near the top of the page by the store name, Statistics Education Resources.
2) Click it to be first to know about my new products, freebies, and discounts!
© Statistics Education Resources, 2019-2022
Disclaimer:
The National Governors Association Center for Best Practices and Council of Chief State School Officers are the sole owners and developers of the Common Core State Standards. © Copyright 2010. National Governors Association Center for Best Practices and Council of Chief State School Officers. All rights reserved.
This product is the work of Statistics Education Resources. Claims of alignment with the Common Core State Standards are the personal opinion of Statistics Education Resources and do not necessarily reflect the official views of the National Governors Association Center for Best Practices and Council of Chief State School Officers. No association with or endorsement by the National Governors Association Center for Best Practices and Council of Chief State School Officers is intended or implied.
