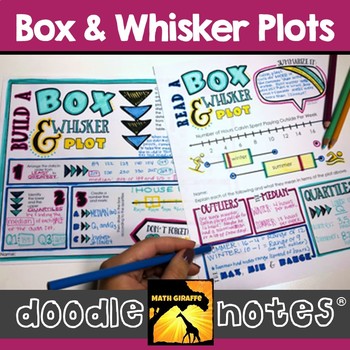
Box and Whisker Plots Doodle Notes
- PDF
What educators are saying
Description
reading and creating box & whisker plots: visual interactive "doodle note" set
When students color or doodle in math class, it activates both hemispheres of the brain at the same time. There are proven benefits of this cross-lateral brain activity:
- new learning
- relaxation (less math anxiety)
- visual connections
- better memory & retention of the content!
Students fill in the sheets, answer the questions, and color, doodle or embellish. Then, they can use it as a study guide later on. Graphic doodle and sketch notes take full advantage of Dual Coding Theory (the way brains process visual and linguistic information) to maximize retention.
Content includes:
- parts of a box plot
- 5 number summary
- representing the median and the spread with the box and whiskers
- quartiles (finding and marking upper and lower quartiles, plus definition)
- analyzing and summarizing data points
- reading a box and whisker plot
- creating a box plot from scratch
- identifying outliers, max and minimum data values, and range
- visual reminders
- practice & examples
Check out the preview for more detail about this item and the research behind it.
Visual note taking strategies like sketch notes or doodle notes are based on dual coding theory. When we can blend the text input with graphic/visual input, the student brain processes the information differently and can more easily convert the new learning into long-term memory.
This strategy also integrates the left and right hemispheres of the brain to increase focus, learning, and retention!
Loving the doodle notes? Grab the full book of Pre-Algebra doodle notes here:


