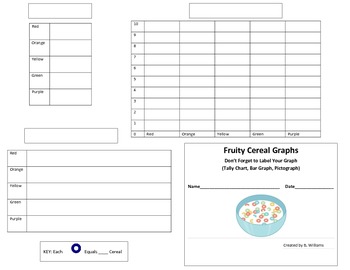
Bar Graph and Pictograph of Fruity Loop Cereal MCC3.MD.3 3.MD.B.3
Ms Creative
26 Followers
Grade Levels
PreK - 4th, Homeschool
Subjects
Resource Type
Standards
CCSS3.MD.B.3
Formats Included
- PDF
Pages
1 page
Ms Creative
26 Followers
What educators are saying
I used this with a Fruit Loops activity on the 100th day of school. It was easy for the kids to record their data.
Description
Students will have a blast engaging in this hands on graph activity. Give each child a baggie with 10 fruit loop ceral pieces and the worksheet. First students will label the different graphs and tally chart. Then they will have to complete the graphs and chart based on their individual materials (cereal).Once their work is complete they can munch on the cereal!
Total Pages
1 page
Answer Key
Does not apply
Teaching Duration
N/A
Report this resource to TPT
Reported resources will be reviewed by our team. Report this resource to let us know if this resource violates TPT’s content guidelines.
Standards
to see state-specific standards (only available in the US).
CCSS3.MD.B.3
Draw a scaled picture graph and a scaled bar graph to represent a data set with several categories. Solve one- and two-step “how many more” and “how many less” problems using information presented in scaled bar graphs. For example, draw a bar graph in which each square in the bar graph might represent 5 pets.


