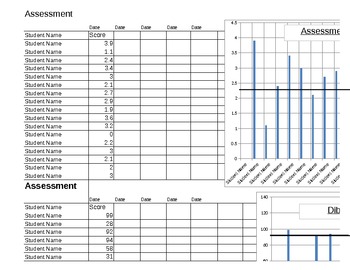
Assessment Graphs - Show student growth - 30 students
MA Smith LOVES Teaching
122 Followers
Grade Levels
PreK - 12th, Higher Education, Adult Education, Homeschool, Staff
Resource Type
Formats Included
- XLS
Pages
4 pages
MA Smith LOVES Teaching
122 Followers
Description
This is a workbook that I use to input student assessments that I give throughout the year. They are assessments that I test over and over again. At my school we use Dibels, Fountas and Pinnell, and Star Math. Any repeated assessment could be use though to track student growth and to make sure students are at grade level.
Where it says Assessment on both the graph and the workbook, input the test title. Where is says Student Name, input the student names. I have put enough fields for 30 students. If you need more, let me know. Where it says Date, input the date, adding each new assessment date as you give it. Where it says score input the scores. I have put enough columns for 5 data points. I use pre-data or data from the previous year in the 1st column. If you choose to use only 4 data points, you'll just have an empty date. (You can also email me and I could fix the graph for you) Also, notice the graph where it says grade level. You will have to move that line and delete my information for you under grade level.
Feel free to ask my any questions. I love to copy and paste the graph into Word and show this to students and parents at conference time.
Total Pages
4 pages
Answer Key
N/A
Teaching Duration
N/A
Report this resource to TPT
Reported resources will be reviewed by our team. Report this resource to let us know if this resource violates TPT’s content guidelines.


