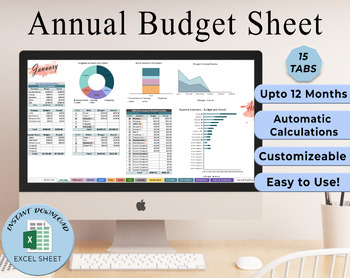
Annual Budget | Budget Template | Personal Budget | Excel Sheets Budget Annual
- PDF
- Excel Spreadsheets
Description
Annual Budget | Budget Template | Personal Budget | Excel Sheets Budget
Certainly! Here's a basic structure for an Annual Budget Spreadsheet in Microsoft Excel:
1. **Income Section**:
- Column A: Month (e.g., January, February, March, etc.)
- Column B: Income Sources (e.g., Salary, Freelance Income, Rental Income, etc.)
- Columns C through N: Monthly Income Amounts
2. **Fixed Expenses Section**:
- Column A: Expense Categories (e.g., Rent/Mortgage, Utilities, Insurance, Loan Payments, etc.)
- Columns B through N: Monthly Expense Amounts
3. **Variable Expenses Section**:
- Column A: Expense Categories (e.g., Groceries, Dining Out, Entertainment, Transportation, Shopping, etc.)
- Columns B through N: Monthly Budgeted Amounts
4. **Savings Goals Section**:
- Column A: Savings Goals (e.g., Emergency Fund, Vacation, Retirement, Education, etc.)
- Columns B through N: Monthly Allocation Amounts
5. **Debt Repayment Section**:
- Column A: Debts (e.g., Credit Card 1, Student Loan, Car Loan, etc.)
- Columns B through N: Monthly Payments
6. **Summary and Analysis Section**:
- Row 1: Total Income, Total Expenses, Total Savings, Surplus/Deficit for Each Month (calculated)
- Row 2: Total Income, Total Expenses, Total Savings, Surplus/Deficit for the Entire Year (calculated)
- Additional rows or charts for visualizing spending patterns and trends over time.
7. **Budget Adjustments Section**:
- Space for notes or comments to document any changes or adjustments made to the budget throughout the year.
This structure allows for easy input of income, expenses, savings goals, and debt repayment amounts for each month, as well as automatic calculation of totals and variances. Users can customize the spreadsheet by adding additional categories, adjusting formulas, or incorporating conditional formatting for visual cues.


