Analyzing Data: A Real World Statistics Project
Pushing Forward with a Math Mindset
20 Followers
Grade Levels
6th - 7th
Subjects
Standards
CCSS6.SP.A.3
CCSS6.SP.B.4
CCSS6.SP.B.5
CCSS7.SP.A.1
CCSS7.SP.A.2
Formats Included
- PDF
Pages
6 pages
Pushing Forward with a Math Mindset
20 Followers
Description
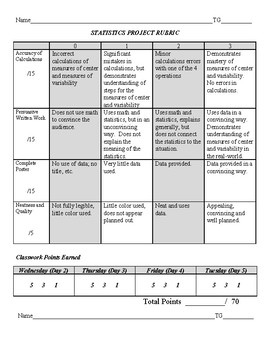
This statistics project asks students to display their understanding of measures of center and measures of variability in a real life situation. Students must calculate the measures of center and variability and create a data driven argument for installing a speed bump outside of their school. This package consists of a rubric, a project and product overview, a student checklist, partner choice handout and a brief handout for an alternative project.
Total Pages
6 pages
Answer Key
Included with rubric
Teaching Duration
1 Week
Report this resource to TPT
Reported resources will be reviewed by our team. Report this resource to let us know if this resource violates TPT’s content guidelines.
Standards
to see state-specific standards (only available in the US).
CCSS6.SP.A.3
Recognize that a measure of center for a numerical data set summarizes all of its values with a single number, while a measure of variation describes how its values vary with a single number.
CCSS6.SP.B.4
Display numerical data in plots on a number line, including dot plots, histograms, and box plots.
CCSS6.SP.B.5
Summarize numerical data sets in relation to their context, such as by:
CCSS7.SP.A.1
Understand that statistics can be used to gain information about a population by examining a sample of the population; generalizations about a population from a sample are valid only if the sample is representative of that population. Understand that random sampling tends to produce representative samples and support valid inferences.
CCSS7.SP.A.2
Use data from a random sample to draw inferences about a population with an unknown characteristic of interest. Generate multiple samples (or simulated samples) of the same size to gauge the variation in estimates or predictions. For example, estimate the mean word length in a book by randomly sampling words from the book; predict the winner of a school election based on randomly sampled survey data. Gauge how far off the estimate or prediction might be.


