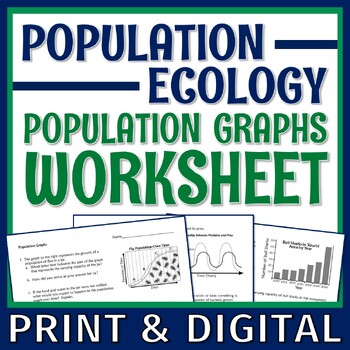
Analyze Populations Graphs Worksheet with Carrying Capacity and Limiting Factors
Flying Colors Science
4.8k Followers
Grade Levels
6th - 8th
Subjects
Resource Type
Standards
NGSSMS-LS2-2
NGSSMS-LS2-3
NGSSMS-LS2-4
NGSSMS-LS2-1
Formats Included
- PDF
- Google Apps™
- Easel Activity
Pages
3 pages
Flying Colors Science
4.8k Followers

Includes Google Apps™
The Teacher-Author indicated this resource includes assets from Google Workspace (e.g. docs, slides, etc.).
Easel Activity Included
This resource includes a ready-to-use interactive activity students can complete on any device. Easel by TPT is free to use! Learn more.
What educators are saying
I teach struggling high school students. Even though the resource is designed for middle school, it addresses a good portion of a high school standard at a level accessible to my English learners and struggling readers. It was very helpful, and I will use it again!
Great set of graphs and questions to cover population biology. I was looking for a bit more graphing work with my biology students when covering population dynamics and this worked.
Also included in
- Never search for "something to do tomorrow" ever again! This bundle contains PRINT AND GO lessons, NO PREP activities, LOW PREP labs, and ENGAGING articles to supplement and thoroughly enhance a life science course. Every included resource is easy to implement, standards-based, and high-quality.Price $399.99Original Price $750.85Save $350.86
- SAVE MORE THAN 30% when you bundle everything you'll need to cover biological populations for middle school! Includes engaging lessons to teach and assess concepts such as carrying capacity and limiting factors of populations. All of the work has been done for you - from start to finish!This mini-Price $13.50Original Price $19.47Save $5.97
Description
In this ecological populations worksheet, students analyze 9 simple populations graphs to get more familiar with understanding changes in populations and reading simple graphs. INCLUDES DIGITAL GOOGLE SLIDES VERSION!
⭐ Get this activity at a discount in our POPULATIONS MINI-UNIT!
Students will practice the following skills:
- How to INTERPRET basic population graphs
- ESTIMATE carrying capacity by looking at a population graph
- ANALYZE how limiting factors affect populations
This activity is designed as an introductory-level activity for population graphs. It does not require students to generate any graphs, only analyze them.
You may also be interested in these corresponding resources:
- Populations Reading and Worksheet
- Carrying Capacity Graphing Activity
- Limiting Factors of Endangered Species
⭐ Find these activities in our POPULATIONS MINI-UNIT! ⭐
Teacher Notes:
- INCLUDES ANSWER KEY.
- A link to access the Google Slides version of this activity is included in the downloadable PDF.
- Please note: this resource is not editable.
- We have lots of Ecology Resources in the ECOLOGY SECTION OF OUR STORE.
Total Pages
3 pages
Answer Key
Included
Teaching Duration
N/A
Report this resource to TPT
Reported resources will be reviewed by our team. Report this resource to let us know if this resource violates TPT’s content guidelines.
Standards
to see state-specific standards (only available in the US).
NGSSMS-LS2-2
Construct an explanation that predicts patterns of interactions among organisms across multiple ecosystems. Emphasis is on predicting consistent patterns of interactions in different ecosystems in terms of the relationships among and between organisms and abiotic components of ecosystems. Examples of types of interactions could include competitive, predatory, and mutually beneficial.
NGSSMS-LS2-3
Develop a model to describe the cycling of matter and flow of energy among living and nonliving parts of an ecosystem. Emphasis is on describing the conservation of matter and flow of energy into and out of various ecosystems, and on defining the boundaries of the system. Assessment does not include the use of chemical reactions to describe the processes.
NGSSMS-LS2-4
Construct an argument supported by empirical evidence that changes to physical or biological components of an ecosystem affect populations. Emphasis is on recognizing patterns in data and making warranted inferences about changes in populations, and on evaluating empirical evidence supporting arguments about changes to ecosystems.
NGSSMS-LS2-1
Analyze and interpret data to provide evidence for the effects of resource availability on organisms and populations of organisms in an ecosystem. Emphasis is on cause and effect relationships between resources and growth of individual organisms and the numbers of organisms in ecosystems during periods of abundant and scarce resources.


