Analysis of Graphs; lying with data and facts
Mr Hands Class Econ History
23 Followers
Grade Levels
7th - 12th
Resource Type
Formats Included
- PDF
Pages
21 pages
Mr Hands Class Econ History
23 Followers
Description
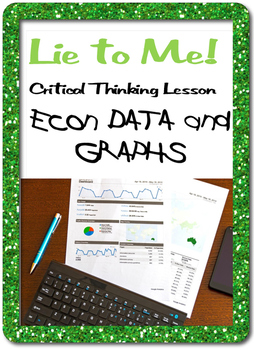
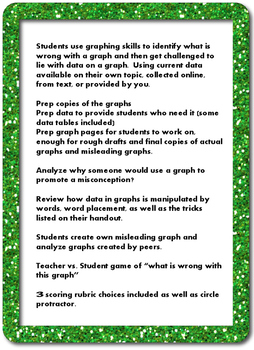
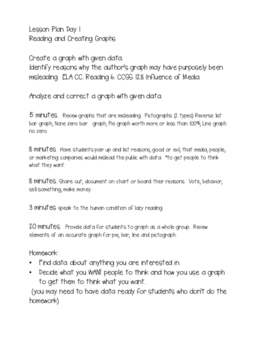
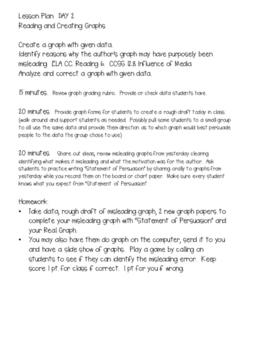
This an engaging lesson where kids review graphing skills, create graphs and analyze others.
Lesson will take 3 days but can be stretched to a week with presentations, or more discussion or examples and the use of "data" confusion by media.
Fits in with ELA standard of identifying purpose of author and referencing text in an argument.
Discuss motives, bias, marketing and persuasion combined with the fact that Americans are "lazy" readers and can be mislead by just tossing up some data.
3 rubrics to choose from.
A few data tables to provide for kids who won't research on their own.
Graphing worksheet with space for a "statement of persuasion" A formal statement as to what their graph is trying to get people to believe.
Circle protractor for kids who want to create a pie chart.
Can fit in Social Sciences in so many places.
GATE kids will enjoy the creativity combined with the data they present to convince you/class the truth of their message.
Directions of how to level for struggling readers or the reluctant learner.
Total Pages
21 pages
Answer Key
Rubric only
Teaching Duration
3 days
Report this resource to TPT
Reported resources will be reviewed by our team. Report this resource to let us know if this resource violates TPT’s content guidelines.


