AP Statistics.Represent 2 Categorical Variables (with video of lesson)
- Zip
Also included in
- This Bundle contains everything you will need to prepare your students for success on the AP® exam.I have designed these lessons over the past 12 years teaching AP Statistics. The organization and rigor of the lessons and practice have produced an AP pass rate well over the national average.I am redPrice $275.00Original Price $338.75Save $63.75
- This bundle will contain 8 lessons that cover bivariate data. College Board® Topics 2.1-2.9 are covered in these lessons;Lesson 11: Representing Two Categorical VariablesLesson 12: Statistics for Two Categorical Variables Lesson 13: Representing the Relationship Between Two Quantitative VariablesLesPrice $45.00Original Price $50.00Save $5.00
Description
Unit 2 Lesson 1 (11th lesson of the AP Statistics Curriculum)
If you are interested in purchasing the whole curriculum, click on the links below.
AP Statistics: Whole Curriculum
AP Statistics: Whole Curriculum with videos of lessons
Included in this download:
- Guided Notes
- Notes for teacher
- Lesson Key
- Video of lesson for flipped classrooms or absent students
- Assignment (Homework/Classwork)
- Lesson Quiz (key included)
- Power Point Presentation of lesson
- Keynote Presentation of Lesson
- Link to supplemental material
- Link to Kahn Academy (for extra practice)
In this lesson students will:
- Define key vocabulary
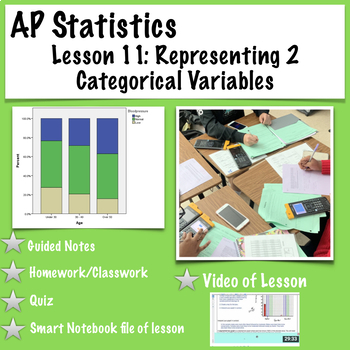
- Create frequency and relative frequency two-way tables (contingency tables)
- Represent the relationship of two or more variables with side-by-side bar graphs, segmented bar graphs, and mosaic plots
- Describe the relationship between variables and determine if there is an
association between those variables
- Find joint relative frequencies from a table
© 2019 Angela Hogan “StatsWithHogan”
All rights reserved. All products purchased from Angela Hogan (StatsWithHogan) may be used by the purchaser for their classroom use only. No part of the publication may be reproduced, distributed, or transmitted without written consent of the author. This includes posting the product on the Internet in any form, including classroom and/or personal websites, social media, or network drives. If you would like to share this product with your team or colleagues, please purchase additional licenses from my store at a discounted price.Lessons 8 and 9 of the AP Statistics Curriculum with a video of the lesson.Lesson 10 of the AP Statistics Curriculum This is lesson 11 of the AP Statistics Curriculum.


