AP Statistics Review of Normal Distribution Histogram Box Plot Shape & Center
- PDF
Description
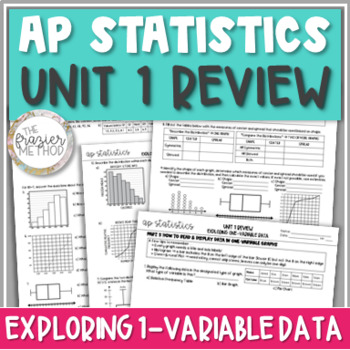
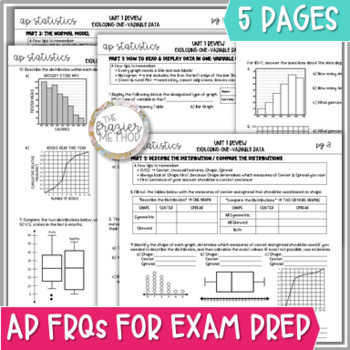
5 PAGES on histograms, boxplots, dot plots, stem-and-leaf, 5 number summary, percentiles, symmetric or skewed shape, median or mean for center, standard deviation or interquartile range for spread, outliers, Normal Distribution, z-scores, and more! This AP STATS EXAM REVIEW for Unit 1: Exploring One-Variable Data is great AP Stats Exam prep without the same old boring multiple choice problems or free response questions!
Aligns with AP College Board’s updated 2019-2020 objectives and standards for AP Statistics Unit 1: Exploring One-Variable Data.
PERFECT FOR…
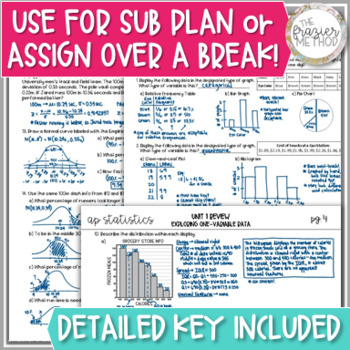
*Sub Plan
*AP Stats Exam Prep
*Thanksgiving, Christmas, or Spring Break Assignment
*End-of-the-Year Review
WHAT’S INCLUDED IN THIS PRODUCT?
Unit 1 Review – 5 Pages
Blank Pages & Answer Key
TOPICS OVERVIEW:
PART 1: HOW TO READ & DISPLAY DATA IN ONE-VARIABLE GRAPHS (Pg. 1-2)
- Categorical & Quantitative Variables
- Relative Frequency Table
- Bar Graph
- Pie Chart
- Dot Plot
- Stem-and-Leaf Plot
- Histogram
- Box Plot
- Cumulative Relative Frequency Plot
- 5-Number Summary
- Percentiles
PART 2: DESCRIBE THE DISTRIBUTION / COMPARE THE DISTRIBUTIONS (Pg. 3-4)
- Shape – Symmetric or Skewed?
- Center – Median or Mean?
- Spread – Standard Deviation, Interquartile Range (IQR), or Range?
- Unusual Features – Outliers, Gaps, or Clusters?
PART 3: THE NORMAL DISTRIBUTION (Pg. 5)
- Z-Scores with Formula
- Empirical Rule (68-95-99.7%)
- Area Under a Normal Curve (%)
- normalcdf & invNorm Calculator Functions
Also included for each lesson to make your Lesson-Planning easier…
- OBJECTIVES
- STANDARDS from updated 2019-2020 AP College Board Standards for AP Statistics Unit 1: Exploring One-Variable Data.
- TERMS OF USE for posting on online teaching sites like Blackboard or Moodle.
*********************************************************************************
MORE FOR UNIT 1:
Describe the Distribution Task Cards Activity
Cumulative Relative Frequency Graphs Worksheet
Review of 1-1, 1-2, 1-3, 1-4, & 1-5 – Bar Graph, Dot Plot, Box Plot, Histogram, etc.
Review of 1-6, 1-7, 1-8, 1-9, & 1-10 – Describe the Distributions & Normal Model
Test on 1-6, 1-7, 1-8, 1-9, 1-10 – Describe the Distributions & Normal Model
Unit 1 Word Wall Bundle: Vocabulary, Graphs, & Calculator Functions
Unit 1 Vocabulary Crossword for FREE
YOU MAY ALSO LIKE:
AP Statistics TI-84 Calculator Functions for the ENTIRE YEAR
AP Statistics Formulas & Vocabulary for the ENTIRE YEAR
SAVE MONEY ON TPT:
Earn TPT credit by reviewing products you buy! Go to "My Purchases" and click “Provide Feedback” next to each product to leave a review. These points add up and can go towards your future purchases! YAY!!!
IF YOU HAVE A QUESTION:
Feel free to message me on TPT by going to my store’s home page and clicking the “Ask A Question” tab near the search bar. You can also email me at annabethfrazier@gmail.com.
Thank you for considering my product for purchase!


