AP Statistics First Week of School Activity
MsDowns Math
31 Followers
Grade Levels
9th - 12th, Homeschool
Subjects
Resource Type
Standards
CCSSHSS-ID.A.1
CCSSHSS-ID.A.2
CCSSHSS-ID.A.3
CCSSHSS-ID.B.5
Formats Included
- PDF
Pages
8 pages
MsDowns Math
31 Followers
Also included in
- Unit 1 - Exploring One Variable DataThis unit follows the College Board curriculum for AP statistics. Included are guided notes and homework for students as well as answer keys and editable quizzes (2 quizzes for this unit). ✔ Each guided notes lesson include vocabulary, tips, and examples.✔ EachPrice $35.51Original Price $39.45Save $3.94
- This bundle includes complete guided notes, homework, and editable quizzes for the first 3 units of AP Statistics. The bundle also includes three FBI Most Wanted activities to use with the units and an activity to use with students during the first few weeks of school.Price $89.42Original Price $99.35Save $9.93
Description
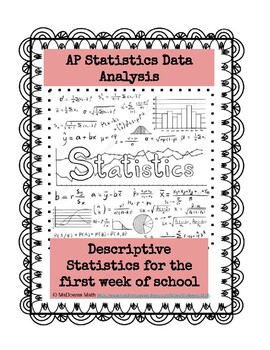
Over the summer, I give my students an assignment based on the first chapter and section 2.1 of chapter 2 in The Practice of Statistics. This activity is a great way to start the year even if your students have not done summer work. The activity has the class collect data and then work through various ways to graph and analyze the data. They use a statistical applet as well as the graphing calculator. Included is the entire activity. An answer key is not applicable as the answers will depend on your class results. The students love it and gets the year off to a great start! - Enjoy and contact me with any questions.
Total Pages
8 pages
Answer Key
Does not apply
Teaching Duration
90 minutes
Last updated Aug 19th, 2019
Report this resource to TPT
Reported resources will be reviewed by our team. Report this resource to let us know if this resource violates TPT’s content guidelines.
Standards
to see state-specific standards (only available in the US).
CCSSHSS-ID.A.1
Represent data with plots on the real number line (dot plots, histograms, and box plots).
CCSSHSS-ID.A.2
Use statistics appropriate to the shape of the data distribution to compare center (median, mean) and spread (interquartile range, standard deviation) of two or more different data sets.
CCSSHSS-ID.A.3
Interpret differences in shape, center, and spread in the context of the data sets, accounting for possible effects of extreme data points (outliers).
CCSSHSS-ID.B.5
Summarize categorical data for two categories in two-way frequency tables. Interpret relative frequencies in the context of the data (including joint, marginal, and conditional relative frequencies). Recognize possible associations and trends in the data.


