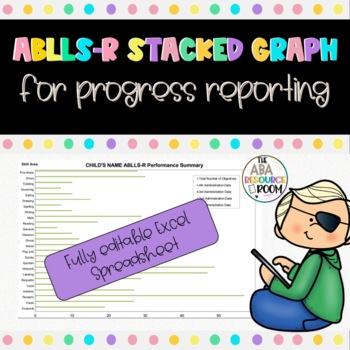
ABLLS-R Stacked Graph
Description
This is a way to track ABLLS-R scores for your learners so that you can see regression across assessments. BCBA, BCaBA, RBT's, therapists, IA staff, or special education teachers are able to input student scores on each section of the ABLLS-R assessment. The values will automatically populate into the charts and will also copy across sheets for easy data entry.
The typical graph included in your packet does not show regression and I created this graph to use for showing parents and professionals when clients do not maintain skills.
The Excel spreadsheet is fully editable. Once you enter data in the main database, it will auto-populate to individual tabs for each section. All the skills now have their own graphs that will auto-complete.
I hope you enjoy using this resource!
If you notice any mistakes or need help with anything please email me at j.johnsonbcba@gmail.com


