A Journey Through Temperatures: Creating and Analyzing Graphs
Megs Study Corner
1 Follower
Grade Levels
5th - 7th, Homeschool
Subjects
Resource Type
Standards
CCSS5.MD.B.2
CCSS5.G.A.1
NGSS5-ESS2-1
Formats Included
- PDF
Pages
3 pages
Megs Study Corner
1 Follower
Description
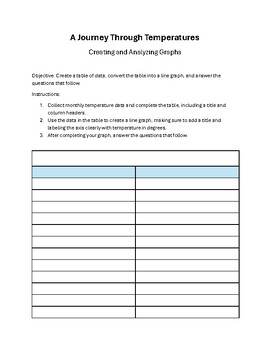
Dive into an engaging, educational journey with "A Journey Through Temperatures," a comprehensive worksheet designed to enhance students' skills in data collection, graph creation, and critical analysis. Perfect for 5th-grade learners, this resource offers a hands-on approach to understanding temperature trends and their broader implications.
Key Features:
- Data Collection and Graph Construction: Students start by gathering monthly temperature data, filling in a provided table, and then using this information to craft their own line graph. This process bolsters skills in both data organization and visual representation.
****For extra fun, select in fascinating destination!
- Critical Thinking and Analysis: The worksheet challenges students to interpret their graph through a series of thought-provoking questions. They'll identify trends, calculate averages, and compare different time periods, promoting deep analytical thinking and comprehension.
- Real-World Connections: Beyond just numbers and charts, students will explore how temperature changes impact daily life and the environment. This encourages learners to consider the practical effects of scientific data, from wardrobe choices to wildlife behavior.
- Educational Objectives: Aimed at strengthening math and science foundations, this worksheet also nurtures curiosity about the world, develops problem-solving skills, and introduces key climate awareness concepts.
Benefits for Educators:
- Easy to Integrate: Designed with busy teachers in mind, this worksheet fits seamlessly into existing curriculum plans for math, science, or geography classes.
- Engages Various Learning Styles: Whether your students are visual learners, hands-on experimenters, or reflective thinkers, this activity caters to diverse educational needs.
- Promotes Independent Learning: Students can embark on this analytical journey individually or in small groups, making it a versatile tool for classroom and homework assignments.
What’s Included:
- A detailed instruction guide for data collection and graph creation.
- A structured table for data input and a template for graph drawing.
- A series of analytical questions focusing on trends, comparisons, and real-world implications.
- Suggestions for further exploration and critical thinking about climate and environmental impact.
Ideal For:
- 5th Grade Math and Science Curriculum
- Cross-Curricular Educational Activities
- Environmental Education and Climate Awareness Initiatives
Embark on "A Journey Through Temperatures" with your students and unlock a world of learning that connects classroom lessons to the global environment. This worksheet is more than just an educational task; it's a stepping stone to a broader understanding of our world.
Total Pages
3 pages
Answer Key
Not Included
Teaching Duration
45 minutes
Last updated 2 months ago
Report this resource to TPT
Reported resources will be reviewed by our team. Report this resource to let us know if this resource violates TPT’s content guidelines.
Standards
to see state-specific standards (only available in the US).
CCSS5.MD.B.2
Make a line plot to display a data set of measurements in fractions of a unit (1/2, 1/4, 1/8). Use operations on fractions for this grade to solve problems involving information presented in line plots. For example, given different measurements of liquid in identical beakers, find the amount of liquid each beaker would contain if the total amount in all the beakers were redistributed equally.
CCSS5.G.A.1
Use a pair of perpendicular number lines, called axes, to define a coordinate system, with the intersection of the lines (the origin) arranged to coincide with the 0 on each line and a given point in the plane located by using an ordered pair of numbers, called its coordinates. Understand that the first number indicates how far to travel from the origin in the direction of one axis, and the second number indicates how far to travel in the direction of the second axis, with the convention that the names of the two axes and the coordinates correspond (e.g., 𝘹-axis and 𝘹-coordinate, 𝘺-axis and 𝘺-coordinate).
NGSS5-ESS2-1
Develop a model using an example to describe ways the geosphere, biosphere, hydrosphere, and/or atmosphere interact. Examples could include the influence of the ocean on ecosystems, landform shape, and climate; the influence of the atmosphere on landforms and ecosystems through weather and climate; and the influence of mountain ranges on winds and clouds in the atmosphere. The geosphere, hydrosphere, atmosphere, and biosphere are each a system. Assessment is limited to the interactions of two systems at a time.


