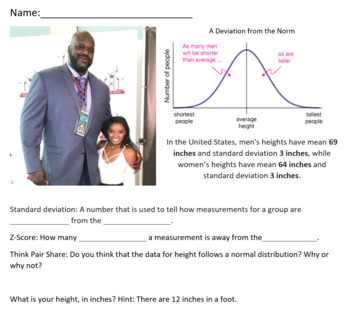
A Deviation From The Norm
Math4Teachers
2 Followers
Grade Levels
9th - 12th
Subjects
Resource Type
Standards
CCSSHSS-ID.A.1
CCSSHSS-ID.A.4
Formats Included
- PDF
Pages
6 pages
Math4Teachers
2 Followers
Description
This lesson teaches students how to apply information about normal distributions, means, standard deviations, and z-scores from real life data about height. The focus of this lesson is conceptual understanding; students will not be computing any standard deviations. However, they will use a given mean, standard deviation, and normal distribution to compute z-scores and percentiles for their own height, their classmates' heights, and celebrities' heights.
Total Pages
6 pages
Answer Key
Included
Teaching Duration
45 minutes
Report this resource to TPT
Reported resources will be reviewed by our team. Report this resource to let us know if this resource violates TPT’s content guidelines.
Standards
to see state-specific standards (only available in the US).
CCSSHSS-ID.A.1
Represent data with plots on the real number line (dot plots, histograms, and box plots).
CCSSHSS-ID.A.4
Use the mean and standard deviation of a data set to fit it to a normal distribution and to estimate population percentages. Recognize that there are data sets for which such a procedure is not appropriate. Use calculators, spreadsheets, and tables to estimate areas under the normal curve.


