TPT
Total:
$0.00

8th Grade enVision Lesson Plans MATH Topic 4 - Investigate Bivariate Data BUNDLE

;
Math with Mrs Meade
12 Followers
Grade Levels
8th
Standards
Formats Included
  • Zip
Pages
20+
$39.96
List Price:
$49.95
You Save:
$9.99
Bundle
$39.96
List Price:
$49.95
You Save:
$9.99
Bundle
Share this resource
Report this resource to TPT
Math with Mrs Meade
12 Followers

Products in this Bundle (5)

    Also included in
    1. This BUNDLE includes 52 LESSON PLANS!This is for the ENTIRE 8th GRADE enVision CURRICULUM!All lesson plans are EXTREMELY DETAILED and directly connect to the enVision Math Curriculum for 8th grade. These are JUST THE LESSON PLAN DOCUMENTS, NOT the actual activities or assessment tools. The lesso
      Price $467.53Original Price $519.48Save $51.95

    Description

    This BUNDLE includes FIVE LESSON PLANS. All lesson plans are EXTREMELY DETAILED and directly connects to the enVision Math Curriculum for 8th grade.

    These are JUST THE LESSON PLAN DOCUMENTS, NOT the actual activities or assessment tools.

    The lessons included in this bundle are for Topic 4 - Investigate Bivariate Data. The lesson titles are as follows:

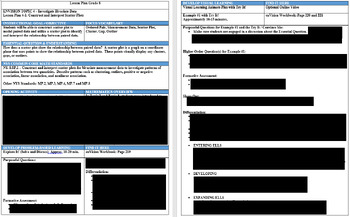
    Lesson 4-1: Construct and Interpret Scatter Plots

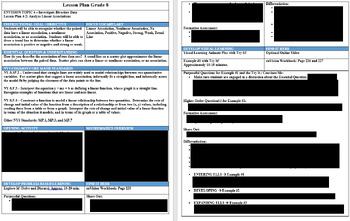
    Lesson 4-2: Analyze Linear Associations

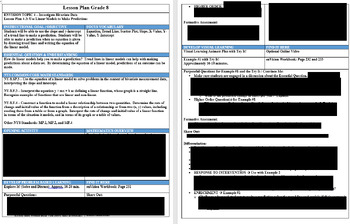
    Lesson 4-3: Use Linear Models to Make Predictions

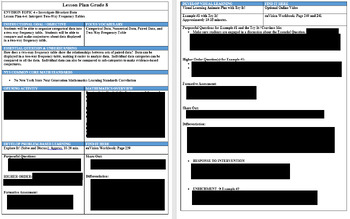
    Lesson 4-4: Interpret Two-Way Frequency Tables

    Lesson 4-5: Interpret Two-Way Relative Frequency Tables

    Each lesson plan is 4 pages long and includes the following categories:

    - enVision Topic

    - Next Generation / Common Core Standards

    - Instructional Goals

    - Essential Question

    - Vocabulary

    - Supplementary Materials

    - Develop Problem Based Learning - Solve & Discuss It

    - Practice and Application Activities

    - Scaffolds / Differentiation / Questioning

    - Developing Visual Learning with Examples and Videos

    - Practice and Application

    -Item Skills Analysis

    - Special Education Component

    - English Language Learner Component

    - SEL Component

    - Review, Assessment, and Extension

    - Teacher Lesson Reflection Questions

    These are JUST THE LESSON PLAN DOCUMENTS, NOT the actual activities or assessment tools.

    **PLEASE REMEMBER TO LEAVE A REVIEW :)

    ***TPT will give you "credits" for every review that you leave!!

    ****Thank you so much in advance!!

    Total Pages
    20+
    Answer Key
    N/A
    Teaching Duration
    2 Weeks
    Report this resource to TPT
    Reported resources will be reviewed by our team. Report this resource to let us know if this resource violates TPT’s content guidelines.

    Standards

    to see state-specific standards (only available in the US).
    Construct and interpret scatter plots for bivariate measurement data to investigate patterns of association between two quantities. Describe patterns such as clustering, outliers, positive or negative association, linear association, and nonlinear association.
    Know that straight lines are widely used to model relationships between two quantitative variables. For scatter plots that suggest a linear association, informally fit a straight line, and informally assess the model fit by judging the closeness of the data points to the line.
    Use the equation of a linear model to solve problems in the context of bivariate measurement data, interpreting the slope and intercept. For example, in a linear model for a biology experiment, interpret a slope of 1.5 cm/hr as meaning that an additional hour of sunlight each day is associated with an additional 1.5 cm in mature plant height.
    Interpret the equation 𝘺 = 𝘮𝘹 + 𝘣 as defining a linear function, whose graph is a straight line; give examples of functions that are not linear. For example, the function 𝘈 = 𝑠² giving the area of a square as a function of its side length is not linear because its graph contains the points (1,1), (2,4) and (3,9), which are not on a straight line.
    Construct a function to model a linear relationship between two quantities. Determine the rate of change and initial value of the function from a description of a relationship or from two (𝘹, 𝘺) values, including reading these from a table or from a graph. Interpret the rate of change and initial value of a linear function in terms of the situation it models, and in terms of its graph or a table of values.

    Reviews

    Questions & Answers

    12 Followers