(7th) Quiz Show Game Probability (Samples and Populations) in a PowerPoint
- Zip
Description
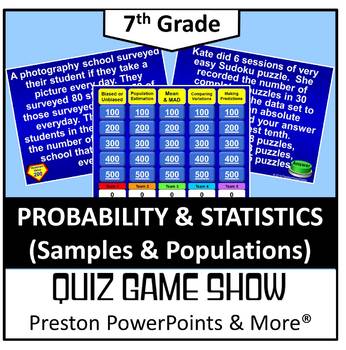
7th Grade Math Quiz Show Game Probability (Samples and Populations) in a PowerPoint Presentation
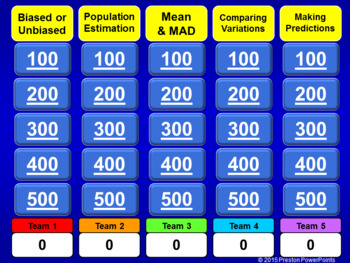
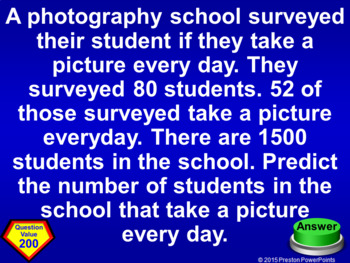
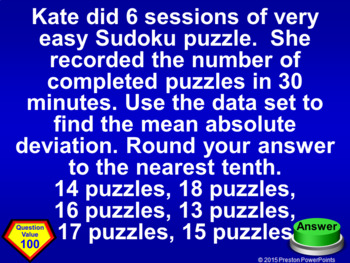
This Quiz Show game, Jeopardy Style, is a great way to review a chapter. There are 25 questions and a scoreboard so you don’t have to write the score on a side board. Each page has the point value!
This Quiz Show game covers all of the following:
Experimental and Theoretical Probability 7.SP.6
Samples and Populations 7.SP.1, 7.SP.2
Comparing Populations with (MAD) 7.SP.3, 7.SP.4
NEW: The lesson is in an editable format so you can tailor the lesson to your class. The problems and clipart can’t be edited due to the TOU and to maintain the copyright integrity of the product. You can change the problem number and the names. Using student’s or teacher’s names can be another hook. If you need an alternative version because your country uses different measurements, units, or slight wording adjustment for language differences just email me at PrestonPowerPoints@gmail.com. I am respond to email quickly.
This Review lesson applies to the Common Core Standard:
Statistics & Probability 7.SP.1, 7.SP.2, 7.SP.3, 7.SP.4, 7.SP.6
Use random sampling to draw inferences about a population.
1. Understand that statistics can be used to gain information about a population by examining a sample of the population; generalizations about a population from a sample are valid only if the sample is representative of that population. Understand that random sampling tends to produce representative samples and support valid inferences.
2. Use data from a random sample to draw inferences about a population with an unknown characteristic of interest. Generate multiple samples (or simulated samples) of the same size to gauge the variation in estimates or predictions. For example, estimate the mean word length in a book by randomly sampling words from the book; predict the winner of a school election based on randomly sampled survey data. Gauge how far off the estimate or prediction might be.
Draw informal comparative inferences about two populations.
3. Informally assess the degree of visual overlap of two numerical data distributions with similar variabilities, measuring the difference between the centers by expressing it as a multiple of a measure of variability. For example, the mean height of players on the basketball team is 10 cm greater than the mean height of players on the soccer team, about twice the variability (mean absolute deviation) on either team; on a dot plot, the separation between the two distributions of heights is noticeable.
4. Use measures of center and measures of variability for numerical data from random samples to draw informal comparative inferences about two populations. For example, decide whether the words in a chapter of a seventh-grade science book are generally longer than the words in a chapter of a fourth-grade science book.
Investigate chance processes and develop, use, and evaluate probability models.
6. Approximate the probability of a chance event by collecting data on the chance process that produces it and observing its long-run relative frequency, and predict the approximate relative frequency given the probability. For example, when rolling a number cube 600 times, predict that a 3 or 6 would be rolled roughly 200 times, but probably not exactly 200 times.
The presentation has 53 slides. Use as many or as few of the problems to help your students learn each concept. For more PowerPoint lessons & materials visit Preston PowerPoints.
Are you looking for the 7th Grade Probability and Statistics Bundle? Click here!
Are you looking for just the 7th Grade Quiz Show Game, Jeopardy, Bundle? Click here!
Are you looking for a Jeopardy that you can put your own problems in? Try this Blank Jeopardy Template. Click here!
This resource is for one teacher only. You may not upload this resource to the internet in any form. Additional teachers must purchase their own license. If you are a coach, principal or district interested in purchasing several licenses, please contact me for a district-wide quote at prestonpowerpoints@gmail.com. This product may not be uploaded to the internet in any form, including classroom/personal websites or network drives.


