
7th Grade Probability & Statistics Spiral Review Game Activity - CCSS Fun Review


- Zip
Also included in
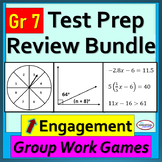 Boost student engagement with this editable 7th Grade Math Test Prep Spiral Review Game Bundle. There are 5 activities in this resource, one on each Common Core Standards domain. The resource is designed to make the review of 7th grade math standards (by units) fun and engaging. Probability and StatPrice $12.07Original Price $17.25Save $5.18
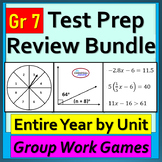 Boost student engagement with this editable 7th Grade Math Test Prep Spiral Review Game Bundle. There are 7 activities in this resource, one on each Common Core Standards domain. The resource is designed to make the review of 7th grade math standards (by units) fun and engaging. Seventh Grade Back tPrice $15.50Original Price $23.25Save $7.75
Description
Ignite engagement with this 7th Grade Probability and Statistics review activity on using random sampling to draw inferences about a population, drawing informal comparative inferences about two populations (mean, mean absolute deviation - MAD), and investigating chance processes and developing, using and evaluating probability models - compound events, sample space, simulations, predictions, etc. Also in my BUNDLE, click HERE.
Perfect for math test prep and building classroom community, this is a cooperative learning, review game group activity, and very aligned to the Common Core Standards. Students engage in problem solving, team building and strategize to earn the most points in order to win.
No prep - just print and go! Editable too. Add or delete questions that you haven't yet covered.
- In this Regressive Point review game, students are in groups. They need to show work in a notebook while answering the questions. The problems can be answered in any order they'd like, which is part of the strategy.
- The first group who correctly answers each problem will earn the highest possible points for that problem. For example, if Group C answers #3 first, they will earn the highest number of points for that problem. If Group F is the 2nd group to answer #3, they will earn the 2nd highest possible points, and so on.
- In the end, the group with the highest number of total points will win 1st place. The group with the 2nd highest number of points will earn 2nd place, and so on. You can give the top-performing groups prizes, extra credit, or other rewards.
- Most 7th grade standards on Geometry are addressed. Feel free to modify the game by adding questions, removing questions, etc. I recommend not allowing calculators.
- Directions for the teacher and students are provided on a Microsoft Word Document and also PDF. Use the data to inform instruction. For example, after the game, use the data to form small groups to support struggling learners and/or differentiate instruction.
Key Words: 7th Grade Math probability and statistics spiral review activity, 7th Grade Math probability of compound events and statistics, 7th Grade probability and stats Test Prep Activity
Standards:
Use random sampling to draw inferences about a population.
1. Understand that statistics can be used to gain information about a population by examining a sample of the population; generalizations about a population from a sample are valid only if the sample is representative of that population. Understand that random sampling tends to produce representative samples and support valid inferences.
2. Use data from a random sample to draw inferences about a population with an unknown characteristic of interest. Generate multiple samples (or simulated samples) of the same size to gauge the variation in estimates or predictions.
3. Informally assess the degree of visual overlap of two numerical data distributions with similar variabilities, measuring the difference between the centers by expressing it as a multiple of a measure of variability.
4.Use measures of center and measures of variability for numerical data from random samples to draw informal comparative inferences about two populations.
Investigate chance processes and develop, use, and evaluate probability models.
5. Understand that the probability of a chance event is a number between 0 and 1 that expresses the likelihood of the event occurring. Larger numbers indicate greater likelihood. A probability near 0 indicates an unlikely event, a probability around indicates an event that is neither unlikely nor likely, and a probability near 1 indicates a likely event.
6. Approximate the probability of a chance event by collecting data on the chance process that produces it and observing its long-run relative frequency, and predict the approximate relative frequency given the probability.
7. Develop a probability model and use it to find probabilities of events. Compare probabilities from a model to observed frequencies; if the agreement is not good, explain possible sources of the discrepancy. a. Develop a uniform probability model by assigning equal probability to all outcomes, and use the model to determine probabilities of events. b. Develop a probability model (which may not be uniform) by observing frequencies in data generated from a chance process.
8. Find probabilities of compound events using organized lists, tables, tree diagrams, and simulation. a. Understand that, just as with simple events, the probability of a compound event is the fraction of outcomes in the sample space for which the compound event occurs. b. Represent sample spaces for compound events using methods such as organized lists, tables and tree diagrams. For an event described in everyday language, identify the outcomes in the sample space which compose the event. c. Design and use a simulation to generate frequencies for compound events.
If you have any questions, please don't hesitate to email me at brettpatrick5@gmail.com. Thanks!
************************************************************************************************
For more information about how Desmos activities work, click here.
Products You May Be Interested In:
7th Grade Math MEGA BUNDLE - Review, Interventions, Escape Rooms - Entire Year
7th Grade Math DIGITAL Escape Rooms | BUNDLE | Review Resources and Activities
Solving Two Step Equations Bundle | Backtrack & Algorithm | Distance Learning
Percent Problems Bundle | Double Number Line | Distance Learning
Inequalities - Matching Graphs Symbols Words | Number Sense Distance Learning
Surface Area of Rectangular Prisms - Interactive Desmos - Distance Learning
************************************************************************************************
************************************************************************************************
LICENSING TERMS When buying this product, you agree that you own a license for one teacher only and that it is for your individual use in your classroom only. Licenses are non-transferable, which means they cannot be passed from one teacher to another. No part of this resource is to be shared with colleagues or used by an entire department, grade level, school or district without purchasing the correct number of licenses. If you are a coach, principal, administrator, or district interested in transferable licenses to accommodate yearly staff changes, please email me at brettpatrick5@gmail.com.
COPYRIGHT TERMS: You may not upload this product, or any part of this product, to the Internet in any capacity, including classroom websites, personal websites, or network drives, unless the site is password-protected and can only be accessed by students.
