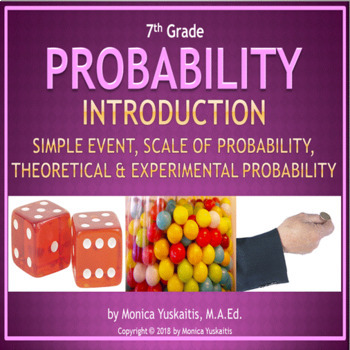
7th Grade Probability 1 - Introduction & Simple Event Powerpoint Lesson
- PPTX
Description
Seventh Grade Probability 1 - Introduction and the Simple Event Powerpoint Lesson is powerful when used as direct instruction in the classroom, on-line, or individually. It explains the difference between the theoretical and experimental and gives examples of problems in both. The simple event is stressed the most in this lesson along with using the scale of probability to predict the likelihood of an event happening. There are 22 effective teaching strategies based on research in this lesson. For best results, students should have white boards and dry erase markers. Included in this powerpoint lesson are the following:
- title slide
- focus slide
- objectives
- Students will be able to describe the probability of a chance event using a fraction, ratio or percent.
- Students will find the likelihood of a chance event happening using a scale from 0 to 1.
- Students will find the likelihood of a chance event happening using a scale from 0 to 1.
- essential question
- How can I find the probability of a simple event?
- vocabulary development
- concept development
- step-by-step demonstration on how to find the probability of a simple event
- checking for understanding
- problem solving with a word problem
- reward slide
Don't forget to leave feedback on this lesson to earn points for purchasing other TpT products.
Be sure to follow my store to be alerted of new products. The first 48 hours is always 50% off. CLICK HERE
You might be interested in the following related powerpoint lesson:


