TPT
Total:
$0.00

6th Grade Math Activity Digital Escape Room - Data and Statistics

Rated 4.81 out of 5, based on 21 reviews
4.8 (21 ratings)
;
Mitchell's Mathematicians
1.6k Followers
Grade Levels
5th - 7th
Resource Type
Standards
Formats Included
  • PDF
  • Google Apps™
Pages
20 pages
$6.00
$6.00
Share this resource
Report this resource to TPT
Mitchell's Mathematicians
1.6k Followers
Includes Google Apps™
The Teacher-Author indicated this resource includes assets from Google Workspace (e.g. docs, slides, etc.).

What educators are saying

This was perfect to review before our test on data and statistics and it was engaging for my students.
A great escape room with varied tasks to reinforce Statistics learning happening in my class. Thank you!
Also included in
  1. I am excited to share these 7 DIGITAL ESCAPE ROOM activities with you. These are great activities to use as a culmination at the end of the year or as a review at the end of a unit. These are completely digital (using Google Forms) and paperless which means no prep work for you. It is easy and self
    Price $33.00Original Price $42.00Save $9.00

Description

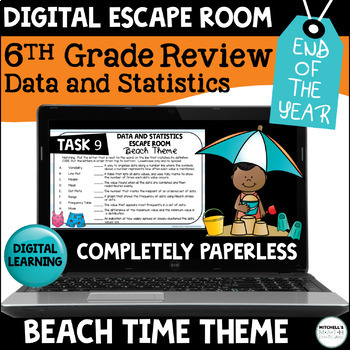
I am excited to share this end of the year DIGITAL ESCAPE ROOM activity with you and your students! It is completely digital (using Google Forms) and paperless which means no prep work for you. It is easy and self grading. Just send the link to your students and they can get started.

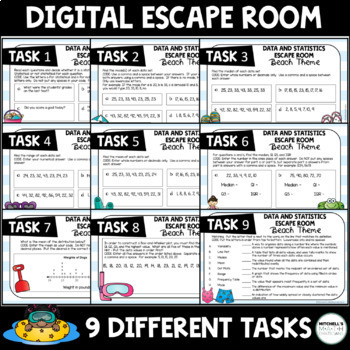
This is based on a beach theme. There is a story that tells about a person going to the beach. There are a few items that they are locked up. In order to "unlock" the items, students will work to complete 9 different task. The tasks are based on the 6th grade statistics and probability CCSS. Once they have successfully complete a task, the students will be told that they are correct, and they can move onto the next task. Once they have completed all 9 tasks, they can submit their responses.

This would be a great end-of-the-year culmination or an awesome way to review after completing the data and statistics unit in your class.

Content Covered

  • Statistical or non-statistical question
  • Finding mode
  • Finding median
  • Finding mean
  • Finding range
  • Finding quartiles and inner quartile range
  • Using line plats to find a measure of center
  • Know how to construct a box-and-whisker plots
  • Vocabulary

I also have created a 6th grade unit on Data and Statistics. It comes in both Google or paper/pencil versions.

Some fun ways to connect....

FOLLOW ME ON TPT.

FOLLOW ME ON FACEBOOK.

FOLLOW ME ON INSTAGRAM.

FOLLOW MY JOURNEY AT MY BLOG.

Total Pages
20 pages
Answer Key
Included
Teaching Duration
N/A
Last updated Mar 31st, 2020
Report this resource to TPT
Reported resources will be reviewed by our team. Report this resource to let us know if this resource violates TPT’s content guidelines.

Standards

to see state-specific standards (only available in the US).
Recognize a statistical question as one that anticipates variability in the data related to the question and accounts for it in the answers. For example, “How old am I?” is not a statistical question, but “How old are the students in my school?” is a statistical question because one anticipates variability in students’ ages.
Understand that a set of data collected to answer a statistical question has a distribution which can be described by its center, spread, and overall shape.
Recognize that a measure of center for a numerical data set summarizes all of its values with a single number, while a measure of variation describes how its values vary with a single number.
Display numerical data in plots on a number line, including dot plots, histograms, and box plots.
Summarize numerical data sets in relation to their context, such as by:

Reviews

Questions & Answers