4.MD.4 SMART Board Lessons [31 Slides, ~1 week of instruction]
Charles Pueschel
83 Followers
Grade Levels
3rd - 4th
Subjects
Resource Type
Standards
CCSS3.MD.B.4
CCSS4.MD.B.4
Formats Included
- NOTEBOOK (SMARTboard) File
Pages
31 pages
Charles Pueschel
83 Followers
Description
**This product was created using SMART Notebook 11**
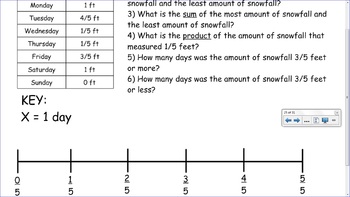
This is a collection of lessons created to address the 4.MD.4 common core standard for fourth grade.
The lessons include:
-Interpreting data on line plots.
-Plotting data by interpreting a table.
-Adding and subtracting fractions with the same denominator.
-Multiplying whole numbers with fractions.
-Converting improper fractions to mixed numbers.
Multi-digit multiplication (four-by-one and three-by-two), division with four-digit dividend and one-digit divisors, and six-digit addition/subtraction problems are included as warm-ups and cool-downs.
There are 31 slides in this file, which should last you approximately one week. The practice problems at the end of each session/lesson can be used as a common assessment.
Please let me know how I can improve these for you. Thank you for your interest in my product!
CharlesS.Pueschel@cms.k12.nc.us
Total Pages
31 pages
Answer Key
N/A
Teaching Duration
1 Week
Last updated Mar 1st, 2014
Report this resource to TPT
Reported resources will be reviewed by our team. Report this resource to let us know if this resource violates TPT’s content guidelines.
Standards
to see state-specific standards (only available in the US).
CCSS3.MD.B.4
Generate measurement data by measuring lengths using rulers marked with halves and fourths of an inch. Show the data by making a line plot, where the horizontal scale is marked off in appropriate units-whole numbers, halves, or quarters.
CCSS4.MD.B.4
Make a line plot to display a data set of measurements in fractions of a unit (1/2, 1/4, 1/8). Solve problems involving addition and subtraction of fractions by using information presented in line plots. For example, from a line plot find and interpret the difference in length between the longest and shortest specimens in an insect collection.


