40 Mean Median Mode & Range Task Cards (> 80 questions), Posters & More
- PDF
What educators are saying
Description
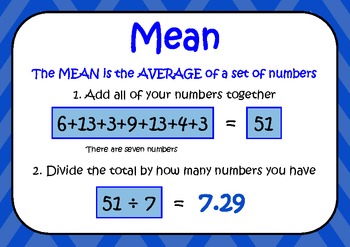
This pack is designed to give students a thorough understanding of mean, median, mode and range. It includes a fun poem (to the tune of Hey Diddle Diddle) to give students a way of always remembering how to calculate the mean, median, mode or range of any data set, as well as 40 task cards of varying complexity, wall reference posters and reference cards for student’s books.
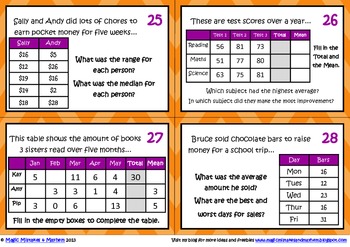
The yellow task cards (1-20) are the easier ones and the orange (21-40), the more complex. The cards can be used in centers, individually or in small groups. Each card contains at least two questions.
Simply print and laminate to use them over and over again, or alternatively print them onto card stock.
Common Core Standards Covered
Statistics & Probability
Develop understanding of statistical variability.
6.SP.2 Understand that a set of data collected to answer a statistical question has a distribution which can be described by its center, spread, and overall shape.
6.SP.3 Recognize that a measure of center for a numerical data set summarizes all of its values with a single number, while a measure of variation describes how its values vary with a single number.
6.SP.5 Summarize numerical data sets in relation to their context, such as by:
a. Reporting the number of observations
b. Describing the nature of the attribute under investigation, including how it was measured and its units of measurements.
c. Giving quantitative measures of center (median and/or mean) and variability (interquartile range and/or mean absolute variation) as well as describing any overall pattern and any striking deviations from the overall pattern with reference to the context in which the data were gathered.
d. Relating the choice of measures of center and variability to the shape of the data distribution and the context in which the data were gathered.


