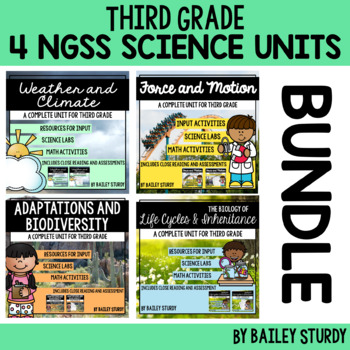
3rd Grade NGSS Science Unit Bundle
- Zip
What educators are saying
Products in this Bundle (4)
Bonus
Description
This bundle includes all 4 units for third grade!
You will find:
Resources for Input
- Inquiry Charts
- Observation Charts
- Big Book (PPT and printable)
- Pictorial and Comparative Input Chart templates (16 total)
- Sociality
- Continental Drift
- Geologic Time Scale
- Natural Selection
- Adaptations
- Ecosystem Dynamics
- Forces on a Rocket
- Balanced vs Unbalanced Forces
- Permanent Magnet vs Electromagnet
- Static Electricity
- Climates Around the World
- What Affects Climate?
- Weather vs Climate
- Hurricanes vs Tornadoes
- Life Cycles (comparative)
- Parity (comparative)
- Acquired Traits
- Inherited Traits
- Chants (10 total)
- Sentence Pattern Charts (printable student copies, teacher samples)
- Expert Group Texts:
- Adaptations and Sociality (set of 6)
- Invasive Species (set of 6)
- Climate Types (set of 5)
- Natural Hazards (set of 6)
- Life Cycles (set of 6)
- Observable Traits (set of 6)
- Types of Forces (set of 5)
- Forces and Variables (set of 5)
- Mind Maps to go with Expert Group texts
- Process Grids to go with Expert Group texts
- Writing Prompts for Narrative, Informational, and Opinion text types (12 total)
Close Reading Sets
13 passages total , each including:
- Essential Question
- Informational Texts at 3 levels: beginning, middle, and end of THIRD GRADE, available as either an article or a reader
- 3 CCSS/DOK Aligned Question Sets
- Journal Prompts (for EQ or DOK 4)
- Titles:
- Mobs, Colonies, and Herds!
- The Fossil Record
- Archaeology/Paleontology (paired text)
- Charles Darwin and Natural Selection
- Meteorology
- Tri-State Tornado/Galveston Hurricane (paired text)
- Seasons and the Earth
- Genetics According to Gregor Mendel
- Insects/Mammals (paired text)
- Instinctive Plant Behaviors
- Newton's Laws of Motion
- Forces on a Rocket
- Forces at the Amusement Park (Roller Coasters/Drop Towers) - paired
These close readings are available in PDF format or digitally as Google Slides™ Presentations. Within each close reading PDF, there is a chart that lists the titles. The levels within that chart will take you to a presentation containing the leveled text, question sets, and journal prompts.
Note: These are the same close readings that are in the 3rd Grade NGSS Close Reading Bundle and the individual close readings (Life Cycles, Weather/Climate, Forces, Adaptations).
Math Integration
17 activities total
- 11 center-type activities
- 6 print-and-go activities
Science Labs
21 total. Titles are:
- Elephant Tag
- Fossil Simulation
- Adaptation Battle
- Bird Beak Simulation
- Invasive Species Design Challenge (alternate version: Environmental Change Design Challenge)
- Weather Multimedia Text Set
- Build an Anemometer
- Weather Conditions by Climate
- Climate Graphing Task Cards
- The Water Cycle
- Weather Hazard Solution Design Challenge
- Acquired Plant Traits
- Height Line Plot
- Life Cycle Model Design
- Hybrid Animal Family Photo Album
- Forces Scavenger Hunt
- Magnetism Lab
- Rocket Science
- Pendulum Lab
- Electromagnets Lab
- Car Design Challenge
Art Integration
- Printables of 22 works of art
- Discussion questions to connect art and science
- 4 art lessons
Assessments
6 summative assessments:
- Life Cycles Assessment (16 questions)
- Weather and Climate (2 assessments; 17 questions and 8 questions)
- Forces and Motion (2 assessments; 13 questions and 16 questions)
- Adaptations and Biodiversity (18 questions)
- Each assessment comes with an answer key
Please see the previews for the individual files for more information.


