3rd Grade Math Review Packet - End of Year Math Worksheets Summer Packet
Thrifty in Third Grade by Cassie Smith
22.9k Followers
Grade Levels
3rd
Subjects
Resource Type
Standards
CCSS3.MD.A.1
CCSS3.MD.B.3
CCSS3.MD.B.4
CCSS3.MD.C.7
CCSS3.MD.C.7a
Formats Included
- PDF
Pages
32 pages
Thrifty in Third Grade by Cassie Smith
22.9k Followers
Description
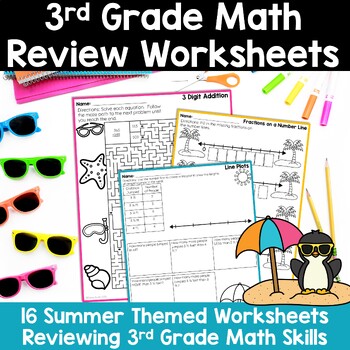
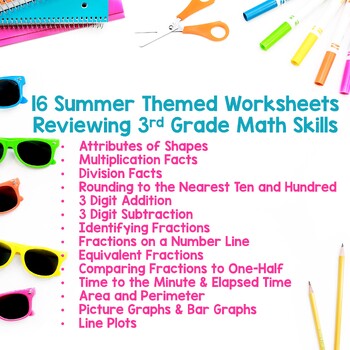
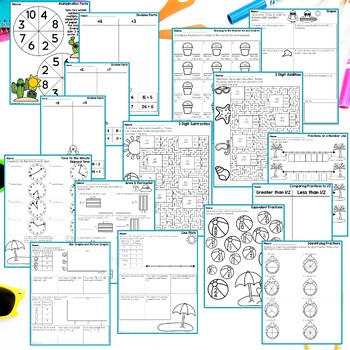
Are you looking for fun worksheets to review 3rd grade math? These 16 summer-themed worksheets cover so many third grade math skills!
They make for a fun way to review at the end of the year, or to practice skills during the summer.
What's Included:
- Attributes of Shapes
- Rounding to the Nearest Ten and Hundred (with fun bonus directed-drawing)
- 3 Digit Addition Self-Checking Maze
- 3 Digit Subtraction Self-Checking Maze
- Multiplication Facts Spinner
- Division Facts Sort (3s, 4s)
- Division Facts Sort (6s, 7s)
- Division Facts Sort (8s, 9s)
- Fractions on a Number Line
- Comparing Fractions to 1/2 Sort
- Equivalent Fractions Coloring
- Identifying Fractions
- Time to the Minute & Elapsed Time
- Area and Perimeter
- Bar Graphs & Picture Graphs
- Line Plots
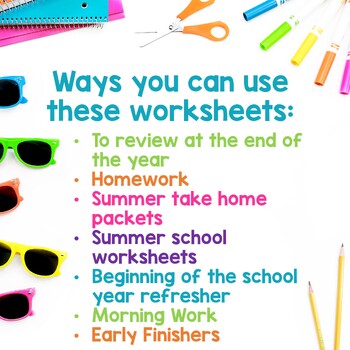
Ways to Use These Worksheets:
- End of year review
- Homework
- Summer take home review packet
- Summer school worksheets
- Beginning of the school year refresher
- Morning work
- Early finishers
Download the preview to see all the worksheets! Answer keys are included!
️⭐Are you looking for more 3rd grade math?⭐️
☀️Want more end of year fun?☀️
©Thrifty in Third Grade
ALL RIGHTS RESERVED
Total Pages
32 pages
Answer Key
Included
Teaching Duration
N/A
Report this resource to TPT
Reported resources will be reviewed by our team. Report this resource to let us know if this resource violates TPT’s content guidelines.
Standards
to see state-specific standards (only available in the US).
CCSS3.MD.A.1
Tell and write time to the nearest minute and measure time intervals in minutes. Solve word problems involving addition and subtraction of time intervals in minutes, e.g., by representing the problem on a number line diagram.
CCSS3.MD.B.3
Draw a scaled picture graph and a scaled bar graph to represent a data set with several categories. Solve one- and two-step “how many more” and “how many less” problems using information presented in scaled bar graphs. For example, draw a bar graph in which each square in the bar graph might represent 5 pets.
CCSS3.MD.B.4
Generate measurement data by measuring lengths using rulers marked with halves and fourths of an inch. Show the data by making a line plot, where the horizontal scale is marked off in appropriate units-whole numbers, halves, or quarters.
CCSS3.MD.C.7
Relate area to the operations of multiplication and addition.
CCSS3.MD.C.7a
Find the area of a rectangle with whole-number side lengths by tiling it, and show that the area is the same as would be found by multiplying the side lengths.


