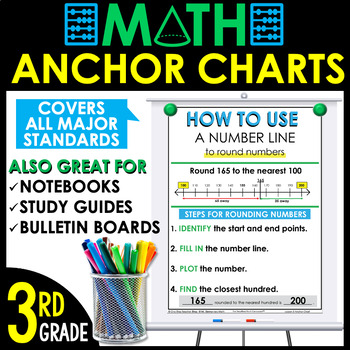
3rd Grade Math Anchor Charts | Math Poster Reference Sheets
- Zip
What educators are saying
Description
How would it feel to have a whole year of 3rd grade math anchor charts done for you? Don't waste time recreating charts to hang in your classroom! We've got you covered!
This packet includes 55 ready-to-go math anchor charts covering ALL major common core standards.
☝☝ Check out the Preview for more details! ☝☝
THIS PACK ALSO INCLUDES:
✔ Step-by-step instructions for printing different sizes.
✔ An “Incomplete” version of MANY anchor charts, so you have the option to fill it in as a class. (Guided math lessons)
SIMPLE IDEAS FOR USING:
✔ Print poster-size and hang on your walls (instructions included)
✔ Reference Sheets to place at math centers
✔ Use in Student Notebooks
✔ Create a math Bulletin Board
✔ Use as a study guide
This awesome resource is divided into 11 topics so that you can easily grab the charts that you need.
WHAT'S TOPICS ARE INCLUDED?
Place Value & Rounding
- Number Form
- Number Representations
- Rounding Chart
- Number Lines & Rounding Numbers
Addition & Subtraction
- Number Line Addition
- Arrow Addition
- Expanded Form Addition
- Subtraction with Place Value
- Number Line Subtraction
- Adding & Subtracting with Number Lines
Multiply & Divide Numbers
- Arrays
- Division Problem Types
- Division (version A)
- Division (version B)
- Fact Families
- Multiples of 10
Multiplication Operations
- Commutative Property
- Zero & Identity Property
- Associative Property
Area & Perimeter
- Area
- Ways to Find Area
- Areas of Composite Shapes
- Area vs. Perimeter
Word Problems & Patterns
- Math Operations
- Representing Unknowns
- Bar Models
- Problem Solving Framework
- Addition Patterns
- Multiplication Patterns
- Number Patterns
Fractions
- Parts of Fractions
- Unit & Non-Unit Fractions
- Fractions on Number Lines less than 1
- Fractions on Number Lines greater than 1
- Equivalent Fractions
- Comparing Fractions with the Same Denominator
- Comparing Fractions with the Same Numerator
Geometry
- Polygons
- Polygon Sides
- Polygon Angles
- Polygon Family
- Quadrilaterals (Exclusive)
- Quadrilaterals (Inclusive)
Time
- Tell Time
- Elapsed Time using Analog Clocks
- Elapsed Time using Number Lines
- Unknown End Time
- Unknown Start Time
Measurement
- Mass: Metric Units
- Mass: Customary Units
- Capacity: Metric Units
- Capacity: Customary Units
Graphing
- Bar Graph
- Picture Graph
- Line Plot
Looking for MORE?
These anchor charts are a part of the Simplified Math Curriculum™.
The Simplified Math Curriculum™ is…
⭐ Time saving with “ready-to-go” lesson presentations and materials.
⭐ Effective in teaching the standards
⭐ Easy to implement for teachers of all levels
⭐ Engaging for students
SAVE TIME with this teacher-friendly curriculum. Click here to learn more
About The Simplified Math Curriculum™
The Simplified Math Curriculum™ was created by two passionate and experienced educators: Greg Coleman from Mr. Elementary Math and Kristin Rivera from One Stop Teacher Shop.
As classroom teachers, curriculum designers, professional development presenters, a math intervention specialist, a math curriculum coach, and a homeschooling parent, Kristin and Greg have pulled from their professional and personal experiences to develop a well-rounded curriculum that supports student learning and promotes quality instruction.
The Simplified Math Curriculum™ provides you with everything you need to TEACH, PRACTICE, and ASSESS all grade-level standards.
★★★★★★★★★★★★★★★★★★★★★★★★★★★★★★★★★★★★★★★★★★★★★★★★★★★★★★
TERMS OF USE - © One Stop Teacher Shop, Inc., © Mr. Elementary Math
This item is a paid digital download from my TpT store
www.teacherspayteachers.com/Store/One-Stop-Teacher-Shop
As such, it is for use in one classroom only. This item is also bound by copyright laws. Redistributing, editing, selling, or posting this item (or any part thereof) on the Internet are all strictly prohibited without first gaining permission from the author. Violations are subject to the penalties of the Digital Millennium Copyright Act. Please contact me if you wish to be granted special permissions!


