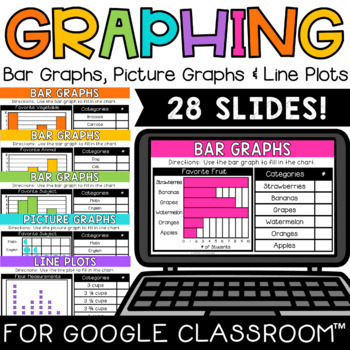
3rd Grade Graphing Bar Graphs Pictographs Line Plots Digital Math Center 3.MD.3
- Google Drive™ folder
- Internet Activities

What educators are saying
Also included in
- This 3rd Grade Measurement and Data bundle gives students a fun way to practice standards 3.MD.1, 3.MD.2, 3.MD.3, 3.MD.4, 3.MD.5, 3.MD.6, 3.MD.7 and 3.MD.8. This is a digital resource using Google Slides™, so students can practice in school or at home. There are 166 student slides total split into 2Price $19.20Original Price $24.00Save $4.80
- This HUGE 3rd grade math curriculum full year bundle includes over 600 activity slides covering ALL 3rd grade math standards. This is a great digital test prep option to review all math standards in a fun and engaging way! Answer pages for all questions also included.What's included:- 600+ activityPrice $69.30Original Price $100.00Save $30.70
Description
This digital graphing activity gives students practice with bar graphs, picture graphs and line plots with fractions (wholes, halves and quarters). There are lots of ways to practice for each type of graph and even slides for students to build their own graphs! There are 28 practice slides + a set of answer slides.
There are 4 graph sets, including:
- 7 slides for horizontal bar graphs
- 7 slides for vertical bar graphs
- 7 slides for scaled picture graphs
- 7 slides for line plots
What each graph set includes:
- 3 slides for students to fill in a data chart from the graph
- 3 slides for students to fill in a graph based on data on a chart (for bar graphs students, will pull the bars to lengthen them; for pictographs and line plots, students will move smiley faces and Xs)
- 1 slide with a blank graph and data chart for students to build their own
Your feedback is important!
Feedback helps other teachers find great resources for their classroom AND rewards you with credit to use on future TPT purchases! You can leave feedback for purchased and free products from your "My Purchases" page.
Follow me to get 50% off new resources!
Click the green star under my logo (on the right side of this page) to grab my new resources half off for the first 48 hours! All products (excluding bundles) are discounted.


