
2nd Grade Math Interactive Notebook - Measurement, Graphing, Money, Telling Time


- PDF
Also included in
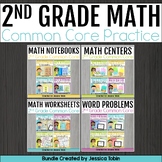 This is a common core aligned math bundle for 2nd grade. There are four bundles included: worksheets, centers, short answer or word problems, and interactive notebook templates. Each packet included standard-specific activities.There are centers, printables, short answer, and interactive notebook tePrice $67.00Original Price $96.25Save $29.25
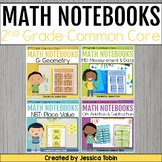 This 2nd grade math Interactive Notebook pack is a resource to use when teaching common core math! This was created to help supplement your lessons! These are in black and white to save your ink! I print on colored paper to make them colorful for the kiddos. Second Grade Math Journal Templates IncluPrice $20.00Original Price $21.00Save $1.00
Description
Are you looking for fun and engaging math Measurement and Data interactive notebook activities? Your students will practice their measurement, telling time, counting money, and graphing skills. There is an input page to read the 'I Can' statement and learn about the standard, then several output pages for practice.
This item aligns with the Common Core standards for the Measurement and Data MD domain, but you don't have to be in a Common Core classroom to use this pack!
Measurement and Data Topics Covered:
- Selecting Appropriate Tools
- Measuring Lengths
- Comparing Two Measurements
- Estimating Lengths
- Comparing Two Objects’ Lengths
- Measurement Word Problems
- Number Lines
- Telling Time
- AM vs. PM
- Counting Money
- Money Word Problems
- Creating Measurement Graphs
- Reading and Making Graphs
You can save money by buying this interactive notebook pack in a bundle of four other CCSS math interactive notebook templates!
You can also save even MORE money by buying this pack within the 2nd Grade Common Core Math Mega Bundle!
Not interested in the bundles? But want more 2nd Grade NBT products?
Like this resource? Make sure to follow my store to keep up with brand-new products!
This purchase is for one single classroom only.
If you're interested in sharing with other classrooms, make sure to buy the extra licenses for a discount through the TeachersPayTeachers tool. If you are interested in a site license, please contact me for a quote at jessica.L.tobin@gmail.com.
Standards Included:
CCSS.Math.Content.2.MD.A.1 (2.MD.1)
Measure the length of an object by selecting and using appropriate tools such as rulers, yardsticks, meter sticks, and measuring tapes.
CCSS.Math.Content.2.MD.A.2 (2.MD.2)
Measure the length of an object twice, using length units of different lengths for the two measurements; describe how the two measurements relate to the size of the unit chosen.
CCSS.Math.Content.2.MD.A.3 (2.MD.3)
Estimate lengths using units of inches, feet, centimeters, and meters.
CCSS.Math.Content.2.MD.A.4 (2.MD.4)
Measure to determine how much longer one object is than another, expressing the length difference in terms of a standard length unit. Relate addition and subtraction to length.
CCSS.Math.Content.2.MD.B.5 (2.MD.5)
Use addition and subtraction within 100 to solve word problems involving lengths that are given in the same units, e.g., by using drawings (such as drawings of rulers) and equations with a symbol for the unknown number to represent the problem.
CCSS.Math.Content.2.MD.B.6 (2.MD.6)
Represent whole numbers as lengths from 0 on a number line diagram with equally spaced points corresponding to the numbers 0, 1, 2, ..., and represent whole-number sums and differences within 100 on a number line diagram. Work with time and money.
CCSS.Math.Content.2.MD.C.7 (2.MD.7)
Tell and write time from analog and digital clocks to the nearest five minutes, using a.m. and p.m.
CCSS.Math.Content.2.MD.C.8 (2.MD.8)
Solve word problems involving dollar bills, quarters, dimes, nickels, and pennies, using $ and ¢ symbols appropriately. Example: If you have 2 dimes and 3 pennies, how many cents do you have?
Represent and interpret data.
CCSS.Math.Content.2.MD.D.9 (2.MD.9)
Generate measurement data by measuring lengths of several objects to the nearest whole unit, or by making repeated measurements of the same object. Show the measurements by making a line plot, where the horizontal scale is marked off in whole-number units.
CCSS.Math.Content.2.MD.D.10 (2.MD10)
Draw a picture graph and a bar graph (with single-unit scale) to represent a data set with up to four categories. Solve simple put-together, take-apart, and compare problems using information presented in a bar graph.
