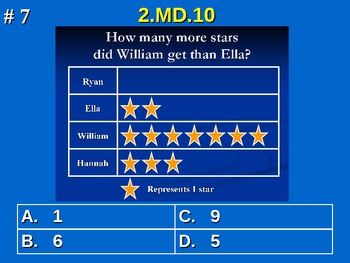
2nd Grade Common Core Math 2 MD.10 Measurement and Data 2.MD.10
Tony Baulos
990 Followers
Grade Levels
2nd, Adult Education, Homeschool
Subjects
Resource Type
Standards
CCSS2.MD.D.10
Formats Included
- PPT
Pages
129 pages
Tony Baulos
990 Followers
Also included in
- 2.MD.10 2nd Grade Math - Draw Picture and Bar Graph Bundle with Google Practice provides two ways for students to practice and show mastery of their ability to represent and interpret data.This bundle provides both my original PowerPoint and the new Google Slide Set products for a low upgrade fee! IPrice $6.00Original Price $9.00Save $3.00
- Note: This 2nd Grade Bundle Pack was assembled to meet the requests of TpT customers who are looking to buy my entire grade level resources in an easy to purchase/download pack at a discount price. Please try my free samples, check out the preview pack which contains a preview of all 26 different fiPrice $163.80Original Price $234.00Save $70.20
Description
Second Grade Common Core Math 2 MD.10 Measurement and Data 2.MD.10 Practice provides two ways for students to practice and show mastery of their ability to represent and interpret data.
It includes 40 distinct problems in two sets (129 slides in all!), with and without following answer slides. The PowerPoint file can be used on computers, or Promethean and Smart boards.
Take a look at the preview file and buy today for your students benefit!
Standard 2.MD.10 Represent and interpret data.
10. Draw a picture graph and a bar graph (with single-unit scale) to represent a data set with up to four categories. Solve simple put together, take-apart, and compare problems using information
presented in a bar graph.
Total Pages
129 pages
Answer Key
Included
Teaching Duration
55 minutes
Last updated Apr 6th, 2013
Report this resource to TPT
Reported resources will be reviewed by our team. Report this resource to let us know if this resource violates TPT’s content guidelines.
Standards
to see state-specific standards (only available in the US).
CCSS2.MD.D.10
Draw a picture graph and a bar graph (with single-unit scale) to represent a data set with up to four categories. Solve simple put-together, take-apart, and compare problems using information presented in a bar graph.


