TPT
Total:
$0.00

2D Shape Turkey Activity | Geometry & Graphing Thanksgiving Math Craft

;
The Mountain Teacher
7.9k Followers
Grade Levels
1st - 3rd
Standards
Formats Included
  • PDF
Pages
35 pages
$3.00
$3.00
Share this resource
Report this resource to TPT
The Mountain Teacher
7.9k Followers

Description

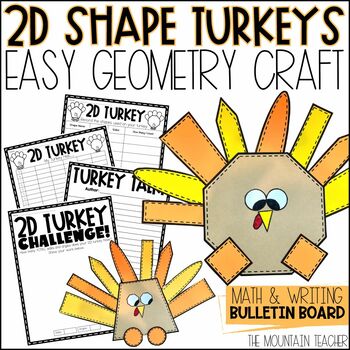
Looking for the best Thanksgiving Math Craft? Create, write, calculate and graph all about your 2D Shape Turkey with this fun geometry and graphing project! Students will learn about 2D shapes, sides, angles, basic graphing, and writing about math during this exciting project.

Project Description: Students will create their Thanksgiving math craft using various colors and shapes on their 2D shape turkey. Then, students will record what shapes were used, graph how many of each shape they used and then will write either a silly story or a short descriptive piece about their 2D shape turkey.

Finally, challenge students by asking them how many TOTAL angles and sides were used on their shape monsters and proving it using calculations.

What's Included:

  • 2D Shape Turkey Craft Pieces (25 pages)
  • Teaching Guide
  • Shape Tracker Worksheet
  • Shape Graph Worksheet
  • Challenge Pages (2 sided)
  • Writing Pages (2 sided)

Need more Geometry Resources?

OR check out my Second Grade Let's Do Math Curriculum, including DAILY warm ups, turn and talks, mini lessons, weekly quizzes, unit assessments, benchmark tests, daily worksheets and so much more.

You can also connect with me for first access to my resources, giveaways and FREEBIES via: Email | Website | Instagram | Facebook | Teachers Pay Teachers

Enjoy! Don't forget to leave feedback on all paid purchases for future credit toward free resources.

Total Pages
35 pages
Answer Key
N/A
Teaching Duration
1 Week
Report this resource to TPT
Reported resources will be reviewed by our team. Report this resource to let us know if this resource violates TPT’s content guidelines.

Standards

to see state-specific standards (only available in the US).
Classify objects into given categories; count the numbers of objects in each category and sort the categories by count.
Organize, represent, and interpret data with up to three categories; ask and answer questions about the total number of data points, how many in each category, and how many more or less are in one category than in another.
Generate measurement data by measuring lengths of several objects to the nearest whole unit, or by making repeated measurements of the same object. Show the measurements by making a line plot, where the horizontal scale is marked off in whole-number units.
Draw a picture graph and a bar graph (with single-unit scale) to represent a data set with up to four categories. Solve simple put-together, take-apart, and compare problems using information presented in a bar graph.
Draw a scaled picture graph and a scaled bar graph to represent a data set with several categories. Solve one- and two-step “how many more” and “how many less” problems using information presented in scaled bar graphs. For example, draw a bar graph in which each square in the bar graph might represent 5 pets.

Reviews

Questions & Answers

7.9k Followers