3 results
Geography Common Core 8.SP.A.2 resources

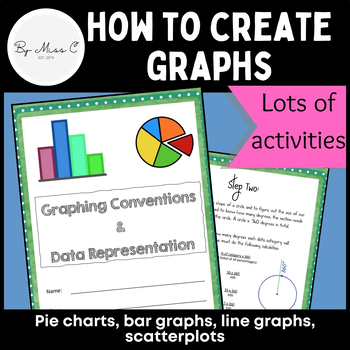
Guide to graphs: Pie charts, bar graphs, line graphs, scatterplots + activities
This is a fantastic resource for introducing students to graphing and data representation. This booklet will take students through the uses for particular graphs and how to construct them. At the end of each module, there are activities for students to complete, to practice their graphing skills. Answer key is included, making this a no-prep activity. This booklet covers: - why we visually represent data- pie charts and how to create them - bar graphs and how to create them - line graphs and how
Subjects:
Grades:
6th - 12th, Higher Education, Adult Education
Types:
CCSS:

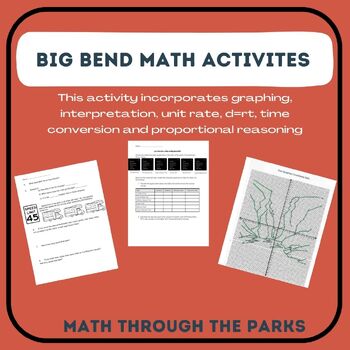
Big Bend Math: Graphing, Converting time, D=Rt, Unit Rate & Coordinate Graph
Hiking Big BendThis activity incorporates the following skills:· Converting minutes to hours and hours to minutes· Unit rate· Graphing and Interpreting· Unit Rate· D=RT· Real world application· Proportional Reasoning Calculating Distance Based on teacher preference you can answer for answers in hours and minutes or just minutes. The answer sheet includes both answers. Also, you can access the actual Big Bend map on the NPS website. This activity incorporates the following skills:· Converting m
Subjects:
Grades:
6th - 8th
Types:

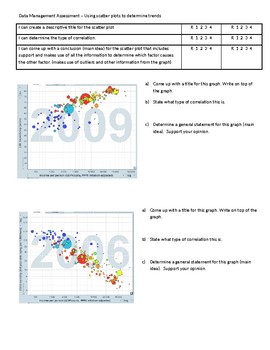
Finding Correlations in Scatter Plot Graphs using Gapminder
Students are presented with a series of scatter plots and asked to create a title and assess the type of correlation (strong, weak, positive, negative, no correlation). Students are also asked to write a brief main idea of what the graph is showing and support it with evidence.
Subjects:
Grades:
6th - 10th
Types:
Showing 1-3 of 3 results


