TPT
Total:
$0.00
Selected
Subjects

Subjects

Arts & Music
English Language Arts
Foreign Language
Holidays/Seasonal
Math
Science
Social Studies - History
Specialty
For All Subject Areas
77 results

Science Common Core 6.SP.B.5 resources
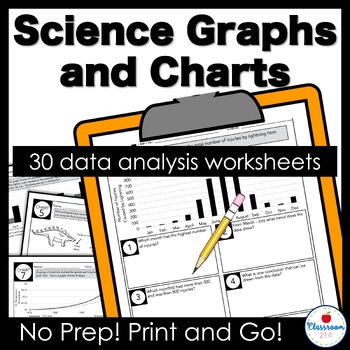
Preview of Middle School Data Analysis Reading Graphs Worksheets
Middle School Data Analysis Reading Graphs Worksheets

Created by
Classroom 214
Reading graphs and interpreting data is challenging. Teach your science students to master comprehending and analyzing charts, graphs, and diagrams in just a few minutes a day! This mega pack gives students a graph or chart and five questions to help them read and analyze it.***This is the print version.***Click here to see the print and digital bundle with four FREE bonus charts!If your students are like mine, they collected data well during a scientific investigation, but struggle to underst
Preview of Mean Median Mode Range Activity (Measures of Central Tendency Activity)
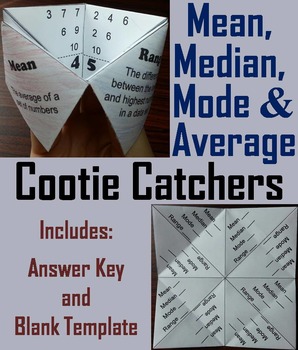
Mean Median Mode Range Activity (Measures of Central Tendency Activity)

Created by
Science Spot
Mean, Median, Mode and Range Cootie Catchers: These cootie catchers/ fortune tellers are a great way for students to have fun while learning about the mean, median, mode, and range of data sets.This product includes the following: 1. How to Play and Assembly Instructions2. Cootie Catcher with data sets w/ blank lines for students to put an answer3. Completed Cootie Catcher with Answers4. Blank Template for students to create their own Cootie CatcherImportant: If you enjoyed this product, check o
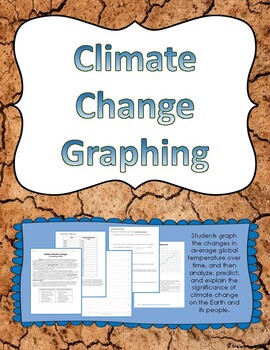
Preview of Climate Change Graphing Activity

Climate Change Graphing Activity

Created by
Kimberly Frazier
Students graph the changes in average global temperature over time, and then analyze, predict, and explain the significance of climate change on the Earth and its people.Students read info related to climate change, then create a graph of average global temperature changes over the past 140 years. Students are then to answer several analysis questions, which could also be used to drive a meaningful classroom discussion about climate change.Included is a teacher's key which shows what the resulti
Preview of Heredity & Genetics Unit - Hands-on Activities, Reading Passages, and Worksheets
Heredity & Genetics Unit - Hands-on Activities, Reading Passages, and Worksheets

Created by
Scienceopoly
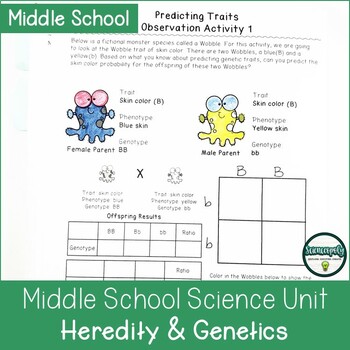
In this unit, students will explore the fundamentals of genetics and heredity. The objective of the unit is that students will be able to identify and explain the advantages and disadvantages of sexual and asexual reproduction.This unit bundle consists of 6 lessons and a final project which can be used as a unit assessment. The bundle also includes a bonus short response formal assessment.In the first lesson, students explore the basics of DNA and terminology used when learning about genetics.In
Preview of A Math Adventure Through the Solar System
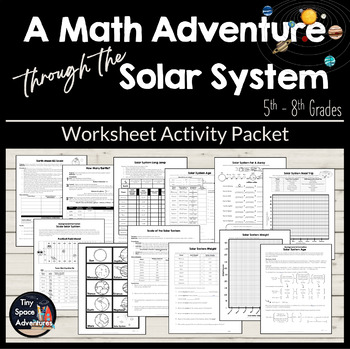
A Math Adventure Through the Solar System

8 FUN math activities included to help your students practice their math skills and learn a little bit about their place in their solar system!Solar System Long JumpOverview: Students figure out their average long jump on Earth, and then based on the gravity of each planet, calculate the distance of that jump on each planet. Solar System WeightOverview: Based on gravity of each planet, students calculate their weight and the measurements of central tendency. Students will then graph their resul
Preview of Weather Temperature Graph with Data Analysis Questions
Weather Temperature Graph with Data Analysis Questions

Created by
Classroom 214
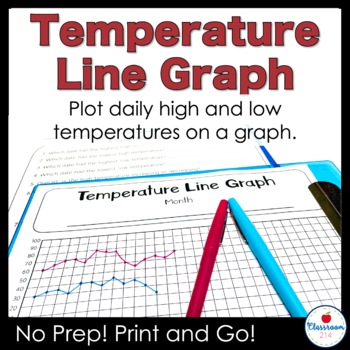
Graph daily high and low temperatures on a line graph. At the end of the month, use the data analysis questions to promote critical thinking about temperature trends and practice graph reading skills. A perfect a weather unit, bell ringer or morning work assignment to sharpen math, earth science, and data analysis skills. WHAT'S INCLUDEDFahrenheit graph (-20 - 100 degrees Fahrenheit)Celsius graph (-20 - 40 degrees Celsius)Seven data analysis questions to be completed at the end of the monthAD
Preview of Graphing Lessons and Activities for Charty Party Game
Graphing Lessons and Activities for Charty Party Game

Created by
Teacher Toy Shop
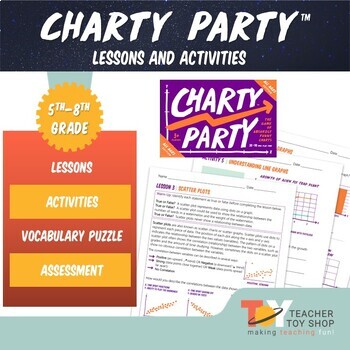
Explore the engaging world of graphing with these Graphing Lessons and Activities for Charty Party Game, featuring nine interactive lessons that seamlessly blend learning with the excitement of a party game. Designed to teach line graphs, bar graphs, scatterplots, and more, these lessons are presented in kid-friendly language, making graphing concepts accessible and enjoyable for students. As they analyze graphs during the Charty Partyâ„¢ game, students not only practice graphing but also delve in
Preview of Predator and Prey Worksheet

Predator and Prey Worksheet

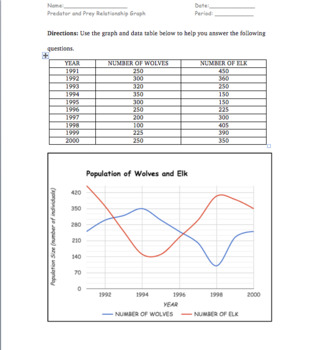
Examine the effects of population size on the organisms in an ecosystem through the predator and prey relationship of wolves and elk. This worksheet is a great review or homework assignment that can be used at multiple grade levels. It also offers an opportunity to practice drawing conclusions from a data table and graph. (MS-LS2-2. Construct an explanation that predicts patterns of interactions among organisms across multiple ecosystems.)
Preview of STEM Family Night Planning & Activity Guide
STEM Family Night Planning & Activity Guide

Created by
Vivify STEM
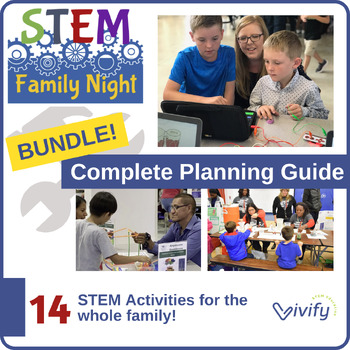
STEM Family Night Planning GuideThis all-inclusive planning guide has everything you need to host a successful STEM Family Night! The guide was created after experience hosting several successful Family Nights with over 350 participants. The activities have been tested by math and science teachers for both elementary and middle school participants and their families. We hope this guide will give you the confidence to host your own amazing STEM Night!14 Activity Guides:Bird FeederBlobs in a Bottl
Preview of Middle School Science Digital Graphs Worksheets
Middle School Science Digital Graphs Worksheets

Created by
Classroom 214
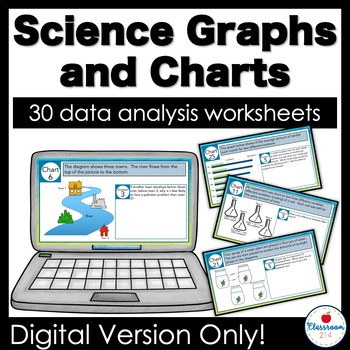
Teach your students to master comprehending and analyzing charts, graphs, and diagrams in just a few minutes a day! This digital mega pack of charts, graphs, tables, and diagrams includes five questions to go with each data set. Use with Googleâ„¢ Slides.***This is the digital version only.***Click here to see the print and digital bundle with four FREE bonus charts.If your students are like mine, they collect data well during a scientific investigation, but struggle to understand and interpret
Preview of Hands-on Genetics Project to Study Inherited Traits, DNA, Genes, and Chromosomes
Hands-on Genetics Project to Study Inherited Traits, DNA, Genes, and Chromosomes

Created by
Scienceopoly
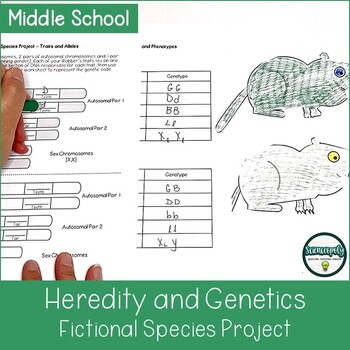
This lesson is designed to be a hands-on, guided assessment project for middle school students who have completed a study of Mendelian genetics, with a focus on dominant and recessive traits, incomplete dominance, and co-dominance. This guided assessment also covers a basic understanding of meiosis, emphasizing the end-result of the process. The lesson is best taught after students have already covered the basics of DNA, cell anatomy and cell division, including meiosis. The objective of this as
Preview of Middle School/Upper Elementary Scientific Method and STEM Fair Unit
Middle School/Upper Elementary Scientific Method and STEM Fair Unit

Created by
Casey Sylvain
This unit was designed as a way to incorporate STEM into a more traditional Science Fair model with connections to STEM careers. Students are encouraged to choose a topic that they are deeply interested in and they learn how to connect scientific thinking to concepts outside of science class. They are also introduced to future STEM careers and community resources. The unit is directly aligned to Next Generation Science Standards (NGSS) and the Common Core. In order to help students achieve t
Preview of What's the Verdict: Sharks vs. Lightning? Modes of Center, Spread, and More!
What's the Verdict: Sharks vs. Lightning? Modes of Center, Spread, and More!

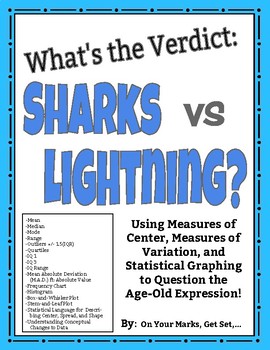
Put it to the test! Use the age-old expression: "You are more likely to get struck by lightning than to be bitten by a shark!" to learn and practice Measures of Center, Measures of Spread, Measures of Shape, and Statistical Graphing including:MEANMEDIANMODERANGEOUTLIERS [Using IQR +/- 1.5(IQR)]QUARTILES [lower quartile (IQ-1) and upper quartile (IQ-3)]INTERQUARTILE RANGE (IQR)MEAN ABSOLUTE DEVIATION/ M.A.D. ft. ABSOLUTE VALUESYMMETRY/ASYMMETRY OF DISTRIBUTIONCLUSTERS AND GAPSBELL SHAPED CURVE AN
Preview of Greece Geography 6th Grade Statistics Box Plot Histogram Mean Median Activity
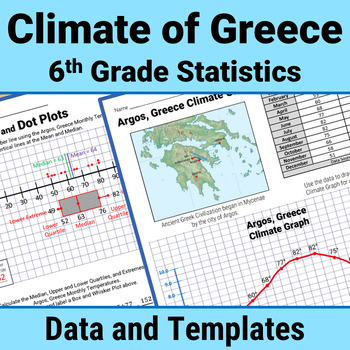
Greece Geography 6th Grade Statistics Box Plot Histogram Mean Median Activity

Enrich your study of Ancient Greece using 6th Grade stats skills to analyze Greek climate data. Calculate Measures of Central Tendency (mean, median, mode, range) and Mean Absolute Deviation. Master Data Display with Box and Whisker Plots, Histograms, Dot Plots, Stem and Leaf Charts. Write Statistical Questions. Analyze Data Distribution and Data Variability.All with climate data (temperature and precipitation) from Greece!This Print and Go STEM/STEAM PBL resource includes 70+ pages of climate d
Preview of Toy Car Golf Math STEAM Design - Gifted and Talented GATE 2nd-4th 9 Hours
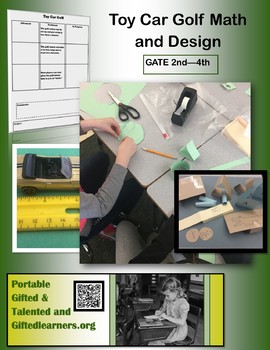
Toy Car Golf Math STEAM Design - Gifted and Talented GATE 2nd-4th 9 Hours

Engaging math and engineering with ramps and toy cars! Your students will go home and share the news about how absolutely cool school seems now. My mathematically gifted 2nd graders were VERY Challenged by this unit, and I would not hesitate to use it for 3rd grade GATE or in 4th grade as an enrichment for the whole class.Schoolhouse Rock Math: We’re using Zero My Hero and 5’s Multiplication to learn multiplication, repeated addition, and patterns to calculate areas of rectangles—a very advance
Preview of Mini Science Fair Project: Surface Tension Lab
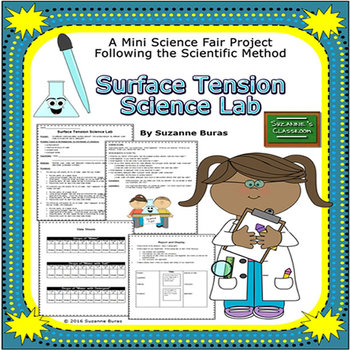
Mini Science Fair Project: Surface Tension Lab

This product was created for a classroom science lab designed to be used to introduce students to the scientific method and to doing a "real" Science Fair Project. It includes all parts of the scientific method and the Science Fair components. The experiment includes a blank lab sheet, detailed, step-by-step instructions for completing the lab, a data sheet, instructions for writing a science report, lab "slips" for grading participation in the lab, and an diagram for helping to set up a displa
Preview of Skittle Radiometric Decay Half-life Lab
Skittle Radiometric Decay Half-life Lab

Created by
3D-PT
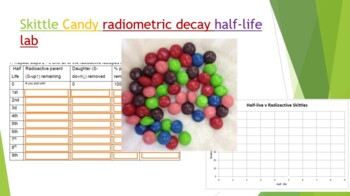
Did you know you can use Skittles candy to demonstrate absolute dating and radiometric decay! Buy a 1-4 lb bag at your local bulk warehouse store for savings. This lab is a great way to show how isotopes decay by shaking a plate full of random skittles. Students use Skittles to observe "Isotopes" decay over each half life. At the end of the lab (and only IF they have done all their work) they can enjoy their "daughter products". Skittles were used because they are durable, hypoallergenic, and th
Preview of Heredity - Dominant and Recessive Mendelian Genetics Activities and Worksheets
Heredity - Dominant and Recessive Mendelian Genetics Activities and Worksheets

Created by
Scienceopoly
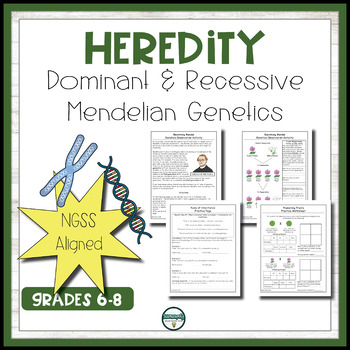
This lesson is designed to give middle school students an introduction to Mendelian genetics, with a focus on dominant and recessive traits. The lesson is best taught after students have already covered the basics of DNA, cell anatomy and cell division, including meiosis. The objective of this lesson is that students will be able to determine the correct phenotype or genotype for a given trait based on their understanding of dominant and recessive traits. They will also be able to predict likely
Preview of Host a Virtual STEM/STEAM Family Night Planning & Activity Guide (With Spanish)
Host a Virtual STEM/STEAM Family Night Planning & Activity Guide (With Spanish)

Created by
Vivify STEM
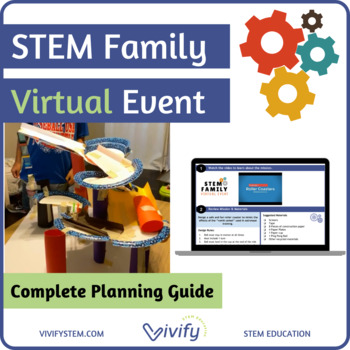
Everything you need to host an all-virtual STEM or STEAM family event! With instructional videos, timeline, sample schedule, editable flyers, printed & digital student handouts, and more this planning and activity guide will help you navigate the challenges of hosting a family event completely online! Tested with elementary and middle school participants and families, we hope this guide will give you the confidence to host your own amazing STEM or STEAM virtual event!*Updated to include han
Preview of Genetic Traits Powerpoint & Simulation Game
Genetic Traits Powerpoint & Simulation Game

Created by
Sunny in Sixth
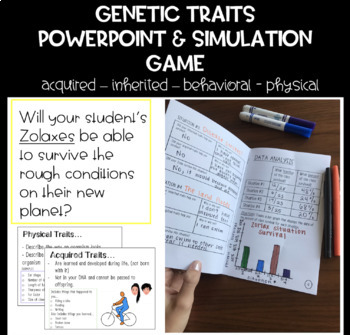
This two-part product is a great resource for introducing the different types of genetic traits, and applying the concepts through an engaging game! The powerpoint is great for engaging in a discussion about different types of traits, and includes a Cornell-note style note page that aligns perfectly. The simulation game is a great application project that includes resources for teacher implementation, as well as a game booklet for students with critical thinking questions and data analyzation.Th
Preview of Rabbit Farm: Project-Based Learning in Genetics & Heredity
Rabbit Farm: Project-Based Learning in Genetics & Heredity

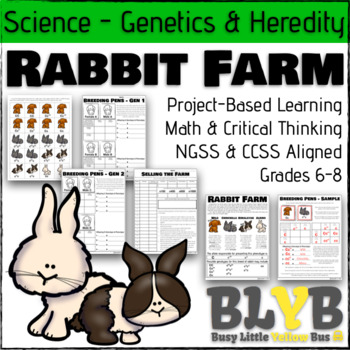
This product includes a single day's lesson plans and resources for a simulated genetics lab. Students will randomly receive four parent rabbits with their genotypes and phenotypes. Students will pen rabbits together and follow them through 2 generations before totaling their value based on phenotypes and discussing how natural selection influences genetics.This product includes:1 - Lab Introduction Page1 - Rabbit Manipulative Page1 - Sample Completed Student Page3 - Student PagesPlease contact
Preview of China Geography 6th Grade Statistics Box Plot Histogram Mean Median Activity
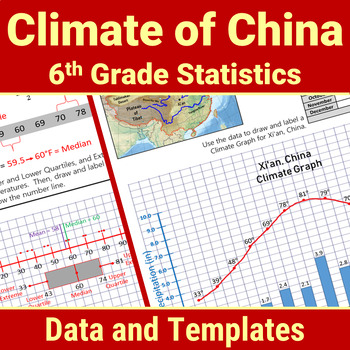
China Geography 6th Grade Statistics Box Plot Histogram Mean Median Activity

Enrich your study of Ancient China using 6th Grade statistics and Probability skills to analyze China climate data. Calculate Measures of Central Tendency (mean, median, mode, range) and Mean Absolute Deviation. Master Data Display with Box and Whisker Plots, Histograms, Dot Plots, Stem and Leaf Charts. Write Statistical Questions. Analyze Data Distribution and Data Variability.All with climate data (temperature and precipitation) from China!This Print and Go STEM/STEAM PBL resource includes 70
Preview of Box and Whiskers Plot Weather Project
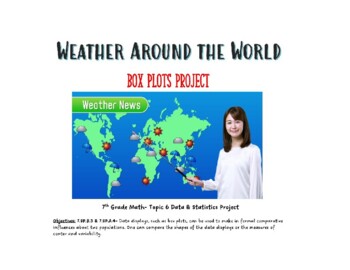
Box and Whiskers Plot Weather Project

Created by
The Math Shack
This is an engaging Data and Statistics Project that integrates math and science. Students will have an opportunity to showcase their knowledge about what they have learned from the Data and Statistics Topic and more specifically Box and Whisker Plots. This project requires students to record the weather in cities around the world and the U.S. using weather.com, give the weather forecast for a specific world and U.S. city, create Box and Whisker Plots with 5-Number Summaries, and make an iMovie
Preview of Exploring Tides. Graphing Data and Patterns Project

Exploring Tides. Graphing Data and Patterns Project

This activity helps students to see the connection between the moon phases and the height of Tides. In this activity students are required to graph the height of the highest tides and the lowest tides of each day given. Then they compare that with the calendar for the new and full moons. The patterns help them discover the relationship between moon phases and tides. Excellent reinforcer of graphing skills with a science connection.
Showing 1-24 of 77 results

Find Science resources | TPT

Importance of learning science

Learning science is particularly important for students as it equips them with the essential knowledge and skills to make sense of the world around them. Science education is not just about memorizing facts. It fosters critical thinking, inquiry, and problem-solving abilities. These skills are not only useful in school but also in everyday life beyond the classroom.

Benefits of learning science

Learning science offers many benefits to students both in school and beyond. In fact, it helps students:

  • Question the world around them and seek evidence-based explanations
  • Cultivate their ability to observe, experiment, and analyze data
  • Nurture a sense of curiosity, awe, and wonder about the natural world
  • Understand natural phenomena and the laws that govern the universe

With a solid foundation in science, teachers can help empower students to think critically, solve problems, make informed decisions, and engage with the world around them in meaningful ways.

Teaching with science resources

One of the best parts about science class is all of the possibilities for hands-on, collaborative learning! Think: labs, experiments, inquiry-based activities, and design challenges. These activities encourage students to explore scientific concepts by observing, asking questions, and conducting investigations. Additionally, with small group centers, students can engage in group experiments, discussions, and projects that require them to collaborate, share ideas, and solve problems together.

Discover printable and digital science resources

If you’re a teacher or parent looking for printable or digital science resources, TPT has an extensive array of instructional materials for every learning need, topic, or grade level. Whether you're learning about plant parts or butterfly life cycles, or exploring advanced topics like the anatomy of a cell or Newton’s laws of motion, we've got you covered.

On TPT, science resources come in various forms: from labs and worksheets to craftivities and doodle notes. They can be used to enhance learning, assess a student’s mastery of science concepts, or to reteach a tricky topic. With plenty of TPT resources at your fingertips, teaching and learning science will be so much easier. Plus, you can expand students’ knowledge even further by exploring TPT math resources, which are frequently paired with science lessons.

Frequently asked questions about teaching science

What types of science lessons are available on TPT?

There are many different types of science resources sold by Sellers on TPT. Some popular science lessons include biology, earth sciences, chemistry, environment, engineering, and anatomy.

How do I find science lessons on TPT?

Educators can save time preparing science lessons with resources created by experienced teachers. Simply start a search for science resources on the TPT marketplace, and filter by grade level, price, and/or resource type to find materials that've been proven to work in classrooms like yours. No matter what you’re teaching, there are plenty of science lessons and activities sold by Sellers on TPT that are tailored to meet your students' skill levels.

How can I make my science lessons fun and engaging?

Students learn best when they're engaged! Sprinkle a little fun into your science lessons and make them feel like real scientists by investigating everyday objects, exploring the world outside the classroom, and doing hands-on and collaborative experiments and design challenges.