36 results
Not grade specific statistics resources on sale
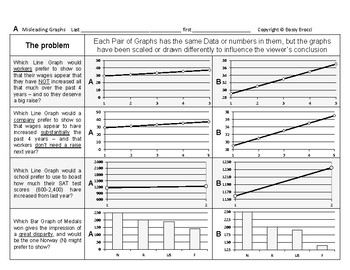
Stats&Data 14: Misleading & Misinterpreting Data Graphs Charts Statistics
This is an excerpt from my popular line ofBossy Brocci Math & Big Science workbooks on Amazon.ANSWER KEY included=======================Students will:1) Analyze 20 different Graphs or Data Displays2) Draw Conclusions & Answer questions about theaccuracy, fairness, limitations & legitimacy of those Graphs3) Answer 16 Multiple-choice questionsbased on their Calculations & Observations4) Be compelled to show their work in a neat & orderly format5) Be trained to methodically &
Subjects:
Grades:
Not Grade Specific
Types:
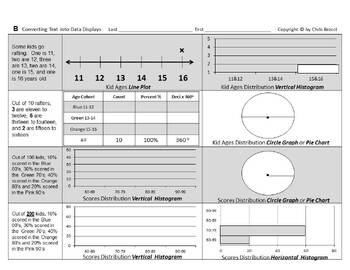
Stats&Data Bundle C: Data Displays Measures of Central Tendency & Variation
From the Author of Bossy BrocciMath & Big Science workbooks on Amazon,this Bundle of Data Displays,Measures of Central Tendency(Mean, Median, Mode & Range);and Measures of Variation(Quartiles, Interquartile Range, Outliers & Box Whisker plots)contains:11 Lessons32 Worksheets832 Problems & Tasks- and Assessment up the a$$=======================Answer KEYS included=======================Coverage Specifics:#1 Identify & Select Common Typesof Data DisplaysStudents will:1) Identi
Subjects:
Grades:
Not Grade Specific
Types:
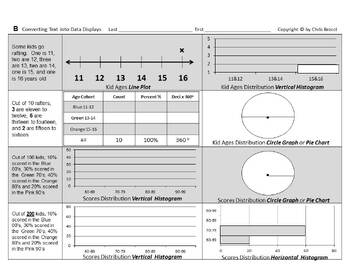
Stats&Data Slides Bundle C: Data Displays Measures of Central Tendency Variation
From the Author of Bossy BrocciMath & Big Science workbooks on Amazon,comes student fillable editable interactiveGoogle Slides™ for Google Classroom™ Students can insert/overlay text & graphics[textboxes, shapes, lines, arrows, colors etc.]onto the G-Slide image backgroundorConvert to PDF, then make it interactive onlineby using various third-party Ed. websitesorPrint it for paper worksheets=======================This Bundle of Data Displays,Measures of Central Tendency(Mean, Median, M
Subjects:
Grades:
Not Grade Specific
Types:
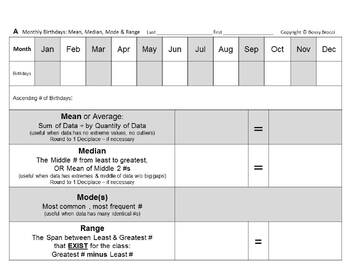
Stats&Data Bundle B: Birthdays Data Displays Variation Mean Median Mode Range
From the Author of Bossy BrocciMath & Big Science workbooks on Amazon,this Birthdays Stats (Mean, Median, Mode, Range),Measures of Variation & Data Displays Bundlecontains:2 Lessons12 Worksheets294 Problems & Tasks- and Assessment up the a$$=======================Answer KEY included=======================Coverage Specifics:#1 Author's Numbers Birthdays ProjectStudents will:1) Convert the given Monthly Birthdaysfrom Mr. Brocci's School numbers into:Ascending List/Data SetMeanMedianMod
Subjects:
Grades:
Not Grade Specific
Types:
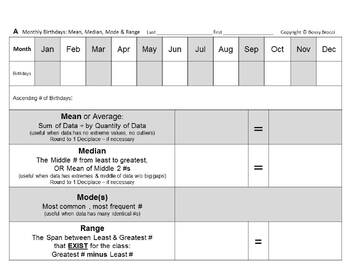
Stats&Data Slides Bundle B: Birthdays Data Displays Variation Mean Median Mode
From the Author of Bossy BrocciMath & Big Science workbooks on Amazon,comes student fillable editable interactiveGoogle Slides™ for Google Classroom™ Students can insert/overlay text & graphics[textboxes, shapes, lines, arrows, colors etc.]onto the G-Slide image backgroundorConvert to PDF, then make it interactive onlineby using various third-party Ed. websitesorPrint it for paper worksheets=======================This Birthdays Stats (Mean, Median, Mode, Range),Measures of Variation &am
Subjects:
Grades:
Not Grade Specific
Types:
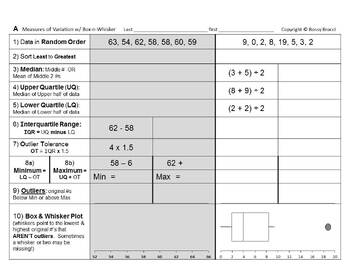
Stats&Data Slides Bundle A: Measures of Variation Box & Whisker Box Plots
From the Author of Bossy BrocciMath & Big Science workbooks on Amazon,comes student fillable editable interactiveGoogle Slides™ for Google Classroom™ Students can insert/overlay text & graphics[textboxes, shapes, lines, arrows, colors etc.]onto the G-Slide image backgroundorConvert to PDF, then make it interactive onlineby using various third-party Ed. websitesorPrint it for paper worksheets=======================This Measures of Variation Box & WhiskerBox Plots Bundlecontains:4 Les
Subjects:
Grades:
Not Grade Specific
Types:
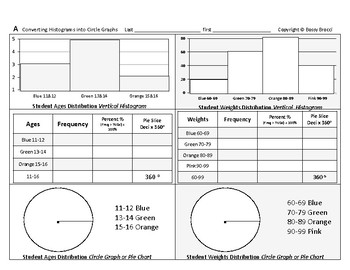
Stats&Data 03: Convert Histograms into Circle Graphs Construct Create Pie Charts
This is an excerpt from my popular line ofBossy Brocci Math & Big Science workbooks on Amazon.Answer KEY included=======================Students will:1) Convert 3 Vertical Histograms into3 Data Tablesand3 Colored or Shaded Circle Graphs (Pie Charts)2) Convert 1 Horizontal Histogram into1 Data Tableand1 Colored or Shaded Circle Graph (Pie Chart)3) Be compelled to show their work in a neat & orderly format4) Be trained to methodically & systematicallyPresent Data in different DisplaysN
Subjects:
Grades:
Not Grade Specific
Types:
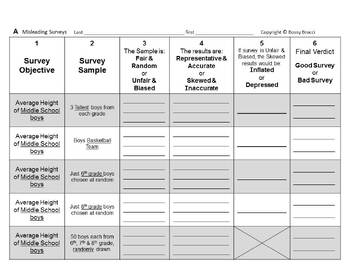
Stats&Data Bundle D: Misleading Misinterpreting Surveys Statistics Graphs Charts
From the Author of Bossy BrocciMath & Big Science workbooks on Amazon,this Bundle onMisleading & MisinterpretingSurveys, Statistics, and Graphs/Chartscontains:2 Lessons8 Worksheets78 Problems & Tasks- and Assessment up the a$$=======================Answer KEYS included=======================Coverage Specifics:#1 Misleading & Misinterpreting Surveys & Statistics+ QUIZStudents will:1) Read 10 different Surveys and Survey Samples2) Determine and Write if those Surveys are:Fair
Subjects:
Grades:
Not Grade Specific
Types:
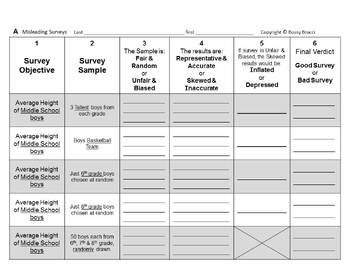
Stats&Data Slides Bundle D: Misleading Misinterpreting Surveys Statistics Graphs
From the Author of Bossy BrocciMath & Big Science workbooks on Amazon,comes student fillable editable interactiveGoogle Slides™ for Google Classroom™ Students can insert/overlay text & graphics[textboxes, shapes, lines, arrows, colors etc.]onto the G-Slide image backgroundorConvert to PDF, then make it interactive onlineby using various third-party Ed. websitesorPrint it for paper worksheets=======================This Bundle onMisleading & MisinterpretingSurveys, Statistics, and Gr
Subjects:
Grades:
Not Grade Specific
Types:
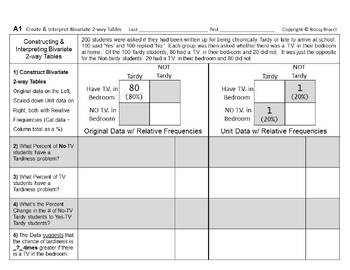
Stats&Data Slides 12: Construct Analyze Bivariate Two-way Frequency Data Tables
From the Author of Bossy BrocciMath & Big Science workbooks on Amazon,comes student fillable editable interactiveGoogle Slides™ for Google Classroom™ Students can insert/overlay text & graphics[textboxes, shapes, lines, arrows, colors etc.]onto the G-Slide image backgroundorConvert to PDF, then make it interactive onlineby using various third-party Ed. websitesorPrint it for paper worksheetsANSWER KEY included=======================Students will:1) Construct a Pair of Raw and Unit/Simpl
Subjects:
Grades:
Not Grade Specific
Types:
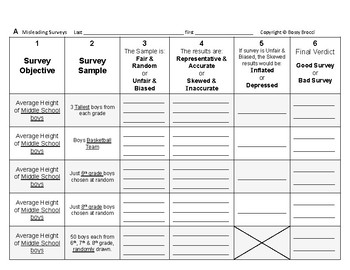
Stats&Data 13: Misleading & Misinterpreting Surveys & Statistics + QUIZ
This is an excerpt from my popular line ofBossy Brocci Math & Big Science workbooks on Amazon.ANSWER KEY included=======================Students will:1) Read 10 different Surveys and Survey Samples2) Determine and Write if those Surveys are:Fair & RandomUnfair & BiasedRepresentative & AccurateSkewed & InaccurateInflatedDepressedGood SurveyBad Survey3) Answer 24 Multiple-choice questionsbased on their Observations4) Analyze 5 Statistical Problems & Conclusions for accuracy
Subjects:
Grades:
Not Grade Specific
Types:
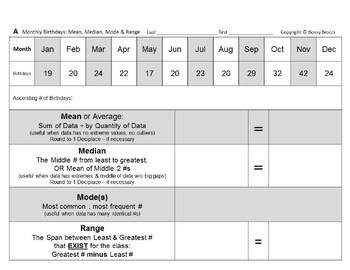
Stats&Data Slides 10: Author Birthdays Variation Central Tendency Data Displays
From the Author of Bossy BrocciMath & Big Science workbooks on Amazon,comes student fillable editable interactiveGoogle Slides™ for Google Classroom™ Students can insert/overlay text & graphics[textboxes, shapes, lines, arrows, colors etc.]onto the G-Slide image backgroundorConvert to PDF, then make it interactive onlineby using various third-party Ed. websitesorPrint it for paper worksheetsAnswer KEY included=======================Students will:1) Convert the given Monthly Birthdaysfro
Subjects:
Grades:
Not Grade Specific
Types:
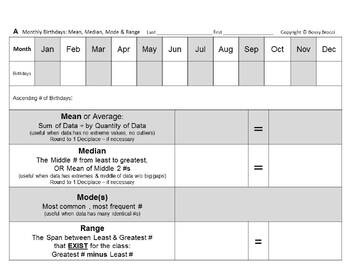
Stats&Data Slides 11: YOUR Birthdays Variation Central Tendency Data Displays
From the Author of Bossy BrocciMath & Big Science workbooks on Amazon,comes student fillable editable interactiveGoogle Slides™ for Google Classroom™ Students can insert/overlay text & graphics[textboxes, shapes, lines, arrows, colors etc.]onto the G-Slide image backgroundorConvert to PDF, then make it interactive onlineby using various third-party Ed. websitesorPrint it for paper worksheets=======================Students will:1) Convert a Monthly Birthdays tallyfrom YOUR School or Clas
Subjects:
Grades:
Not Grade Specific
Types:
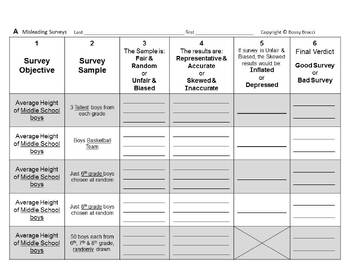
Stats&Data Slides 13: Misleading & Misinterpreting Surveys & Statistics + QUIZ
From the Author of Bossy BrocciMath & Big Science workbooks on Amazon,comes student fillable editable interactiveGoogle Slides™ for Google Classroom™ Students can insert/overlay text & graphics[textboxes, shapes, lines, arrows, colors etc.]onto the G-Slide image backgroundorConvert to PDF, then make it interactive onlineby using various third-party Ed. websitesorPrint it for paper worksheetsANSWER KEY included=======================Students will:1) Read 10 different Surveys and Survey S
Subjects:
Grades:
Not Grade Specific
Types:
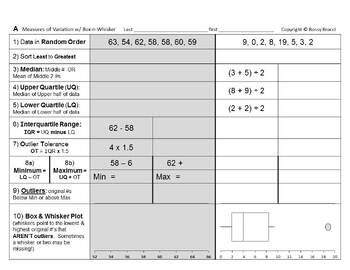
Stats&Data Slides 06: Quartiles Interquartile Range Outliers Box Whisker Plots
From the Author of Bossy BrocciMath & Big Science workbooks on Amazon,comes student fillable editable interactiveGoogle Slides™ for Google Classroom™ Students can insert/overlay text & graphics[textboxes, shapes, lines, arrows, colors etc.]onto the G-Slide image backgroundorConvert to PDF, then make it interactive onlineby using various third-party Ed. websitesorPrint it for paper worksheetsAnswer KEY included=======================Students will:1) Sort or Sequence 8 different Data Sets
Subjects:
Grades:
Not Grade Specific
Types:
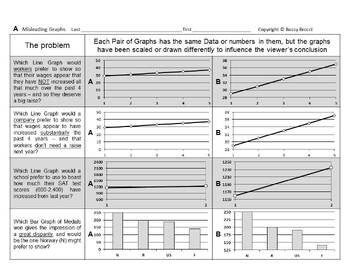
Stats&Data Slides 14: Misleading & Misinterpreting Data Graphs Charts Statistics
From the Author of Bossy BrocciMath & Big Science workbooks on Amazon,comes student fillable editable interactiveGoogle Slides™ for Google Classroom™ Students can insert/overlay text & graphics[textboxes, shapes, lines, arrows, colors etc.]onto the G-Slide image backgroundorConvert to PDF, then make it interactive onlineby using various third-party Ed. websitesorPrint it for paper worksheetsANSWER KEY included=======================Students will:1) Analyze 20 different Graphs or Data Di
Subjects:
Grades:
Not Grade Specific
Types:
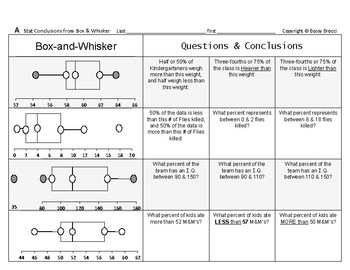
Stats&Data 09: Draw Statistical Conclusions from Box and Whisker Box Plots QUIZ
This is an excerpt from my popular line ofBossy Brocci Math & Big Science workbooks on Amazon.Answer KEY included=======================Students will:1) Analyze 8 Box & Whisker Plots (Box Plots)2) Answer at total of 24 questionsfrom those Plots regarding variousFraction & Percent Distribution portions3) Be compelled to show their work in a neat & orderly format4) Be trained to methodically & systematicallyTranslate or Convert Box & Whisker Plotsinto Fractions & Percen
Subjects:
Grades:
Not Grade Specific
Types:
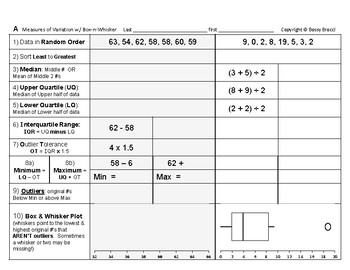
Stats&Data 06: Variation Quartiles Interquartile Range Outliers Box Whisker Plot
This is an excerpt from my popular line ofBossy Brocci Math & Big Science workbooks on Amazon.Answer KEY included=======================Students will:1) Sort or Sequence 8 different Data Sets or Sets of Numbers2) Calculate & Identify for each of the 8 Data Sets the:MedianUpper QuartileLower QuartileInterquartile RangeOutlier ToleranceAllowed MinimumAllowed Maximumandany Outliers3) Draw or Construct the Box and Whisker Plots (Box Plots)directly beneath their calculations4) Be compelled to
Subjects:
Grades:
Not Grade Specific
Types:
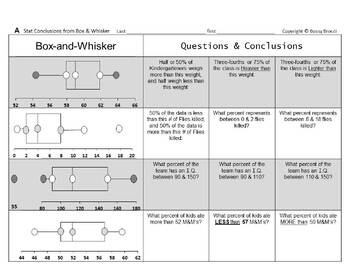
Stats&Data Slides 09: Statistical Conclusions from Box and Whisker Plots QUIZ
From the Author of Bossy BrocciMath & Big Science workbooks on Amazon,comes student fillable editable interactiveGoogle Slides™ for Google Classroom™ Students can insert/overlay text & graphics[textboxes, shapes, lines, arrows, colors etc.]onto the G-Slide image backgroundorConvert to PDF, then make it interactive onlineby using various third-party Ed. websitesorPrint it for paper worksheetsAnswer KEY included=======================Students will:1) Analyze 8 Box & Whisker Plots (Box
Subjects:
Grades:
Not Grade Specific
Types:
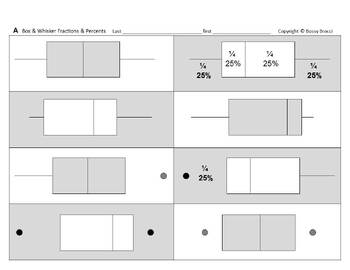
Stats&Data Slides 08: Convert Label Box and Whisker Plots to Fractions Percents
From the Author of Bossy BrocciMath & Big Science workbooks on Amazon,comes student fillable editable interactiveGoogle Slides™ for Google Classroom™ Students can insert/overlay text & graphics[textboxes, shapes, lines, arrows, colors etc.]onto the G-Slide image backgroundorConvert to PDF, then make it interactive onlineby using various third-party Ed. websitesorPrint it for paper worksheetsAnswer KEY included=======================Students will:1) Analyze 16 Box & Whisker Plots (Bo
Subjects:
Grades:
Not Grade Specific
Types:
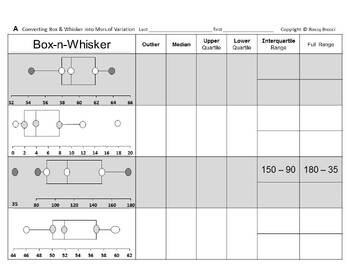
Stats&Data Slides 07: Box Whisker Plots Quartiles Interquartile Range Outliers
From the Author of Bossy BrocciMath & Big Science workbooks on Amazon,comes student fillable editable interactiveGoogle Slides™ for Google Classroom™ Students can insert/overlay text & graphics[textboxes, shapes, lines, arrows, colors etc.]onto the G-Slide image backgroundorConvert to PDF, then make it interactive onlineby using various third-party Ed. websitesorPrint it for paper worksheetsAnswer KEY included=======================Students will:1) Analyze 8 Box & Whisker Plots (Box
Subjects:
Grades:
Not Grade Specific
Types:
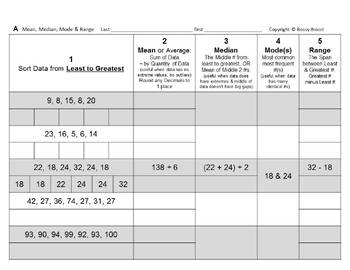
Stats&Data Slides 05: Calculate Measures Central Tendency Mean Median Mode Range
From the Author of Bossy BrocciMath & Big Science workbooks on Amazon,comes student fillable editable interactiveGoogle Slides™ for Google Classroom™ Students can insert/overlay text & graphics[textboxes, shapes, lines, arrows, colors etc.]onto the G-Slide image backgroundorConvert to PDF, then make it interactive onlineby using various third-party Ed. websitesorPrint it for paper worksheetsAnswer KEY included=======================Students will:1) Calculate Mean, Median, Mode and Range
Subjects:
Grades:
Not Grade Specific
Types:
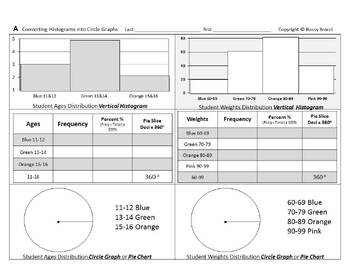
Stats&Data Slides 03: Convert Histograms into Circle Graphs Construct Pie Charts
From the Author of Bossy BrocciMath & Big Science workbooks on Amazon,comes student fillable editable interactiveGoogle Slides™ for Google Classroom™ Students can insert/overlay text & graphics[textboxes, shapes, lines, arrows, colors etc.]onto the G-Slide image backgroundorConvert to PDF, then make it interactive onlineby using various third-party Ed. websitesorPrint it for paper worksheetsAnswer KEY included=======================Students will:1) Convert 3 Vertical Histograms into3 Da
Subjects:
Grades:
Not Grade Specific
Types:
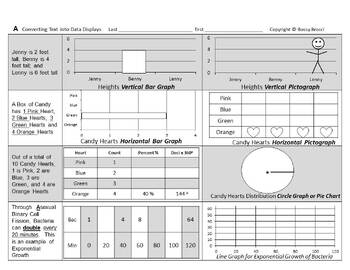
Stats&Data Slides 02: Convert Text & Create Construct Ten Types of Data Displays
From the Author of Bossy BrocciMath & Big Science workbooks on Amazon,comes student fillable editable interactiveGoogle Slides™ for Google Classroom™ Students can insert/overlay text & graphics[textboxes, shapes, lines, arrows, colors etc.]onto the G-Slide image backgroundorConvert to PDF, then make it interactive onlineby using various third-party Ed. websitesorPrint it for paper worksheetsAnswer KEY included=======================Students will:1) Read 8 Word Problems and Convert text
Subjects:
Grades:
Not Grade Specific
Types:
Showing 1-24 of 36 results


