146 results
Common Core HSS-ID.A.2 microsofts
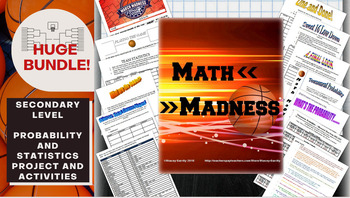
Math March Madness Full Tournament Project {BUNDLE}
Harness the excitement of NCAA March Madness with this huge project for secondary math teachers that follows all stages of the tournament! This Common Core aligned bundle comes with bonus parts not sold individually in my store so you can create a rich immersion in the tournament, practice probability and statistics and learn some interesting new ones along the way! Save $3 plus get bonus content by bundling!You can pick and choose which parts you would like to incorporate, or follow my schedu
Subjects:
Grades:
6th - 12th, Higher Education
Types:
Statistics Project - Statistics Olympics
Engage your students in their study of statistics as they compete in self-created Olympic style events. This project will engage students and help them discover meaning and apply concepts including measures of central tendency, quartiles, outliers, variance, standard deviation, z-scores, box plots, histograms, normal and skewed distributions. This project can be completed in approximately 6-8 days (50-min class periods) ** March 2023 Update **Visual updates to all slides and documentsRubric ali
Subjects:
Grades:
6th - 12th
CCSS:
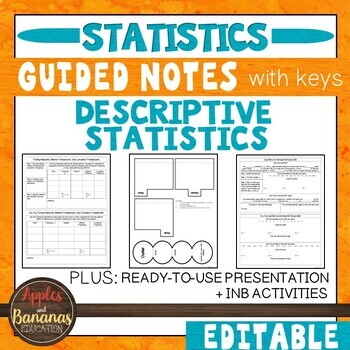
Descriptive Statistics- Guided Notes, Presentation, and INB Activities
This Introduction to Statistics product is flexible, editable, and can be used for in-person or distance learning. Take the time and stress out of creating your own guided notes and presentations. There are many ways to use this engaging bundle. It includes guided notes embedded with student practice problems (keys included), foldable activities, and a PowerPoint presentation for focused instruction. Choose what works best for your class/student and modify to make the content fit your needs. Not
Subjects:
Grades:
9th - 12th
CCSS:
Also included in: Custom Bundle for Viet
High School Math Common Core Aligned IEP Goal Bank
This IEP goal bank was created to assist special education teachers with the task of writing standards-based IEP goals in math. After spending countless hours developing IEP goals myself and really having to think through how to best individualize goals and objectives for my own students, I wanted to share this resource to help other special education teachers gain back some of their time.This goal bank includes the following:An introduction and guide that explains how to use the document.Each s
Subjects:
Grades:
9th - 12th
CCSS:
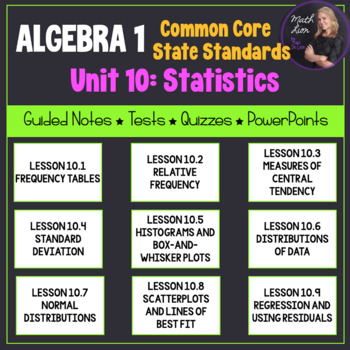
Statistics (Algebra 1 Curriculum - Unit 10) | Bundle for Common Core
This is a great unit that covers a Statistics unit in an Algebra 1 course! 9 lessons are included!All documents are EDITABLE!Included:- Overview of the common core alignment (PDF)- Guided notes for 9 lessons (PDF and Word)- PowerPoints that coordinate with the guided notes (PPTX)- Mid-Unit Quiz (PDF and Word)- Unit Test (PDF and Word)-Pacing Guide (PDF and Word)Each lesson contains a learning scale, warm up (do-now or bell ringer), key concepts, vocabulary, and examples for students to follow w
Subjects:
Grades:
7th - 12th
CCSS:
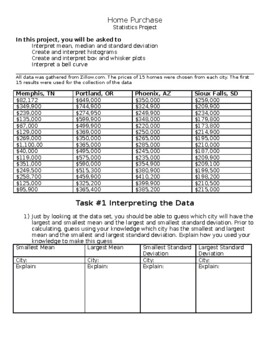
Home Prices: High School Statistics Project
This statistics project has students exploring home prices and using their knowledge of mean, median, standard deviation, histograms, box and whisker plots, and bell curves to make predictions and inferences about the data. This project is provided in a word document to allow the teacher the ability to edit the document or load it to a google doc. In this project students first make predictions about measures of spread and central tendency without calculating but by looking at the data. Students
Subjects:
Grades:
9th - 12th
Types:
CCSS:
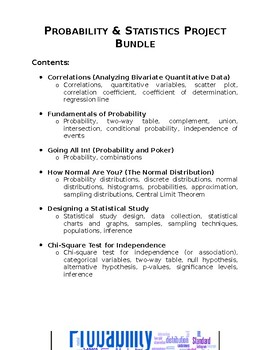
Probability & Statistics Project Bundle
A bundle that contains six different projects for a Probability & Statistics high school course. This bundle includes: Correlations (Analyzing Bivariate Quantitative Data) Fundamentals of Probability Going All In! (Probability, Combinations, and Poker) How Normal Are You? (The Normal Distribution) Designing a Statistical Study Chi-Square Test for Independence These projects are designed to engage students in authentic, hands-on, performance-based tasks. For each of these projects, students c
Subjects:
Grades:
9th - 12th
Types:
CCSS:
Data Project Misleading Data Analysis Statistics
Statistics can be used to share information. Sometimes the data is misleading. In this AP Statistics mini project students examine how data can be used to tell a story AND how that story can be incomplete. This is part of the AP Statistics curriculum.Included in this resource:Warm-up activity for misleading dataMisleading data project guidelinesEditable RubricAnswer key for activityThis resource can be found in the following bundles:AP Statistics CurriculumAP Statistics Unit 1Get students r
Subjects:
Grades:
9th - 12th
Types:
CCSS:
Also included in: Descriptive Statistics AP Statistics
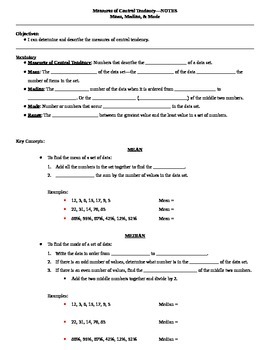
Measures of Central Tendency Guided Notes
These are guided notes for a lesson on measures of central tendency including mean, median, mode, and range. There are several examples in the notes and the same data sets are used to show each measure of central tendency.I have also included a teacher key to show you what to fill in the blanks as your students follow along.To use these notes, I simply projected them onto my whiteboard, gave the students their blank copies, and had them follow along and write what I wrote. This works great when
Subjects:
Grades:
5th - 12th
CCSS:
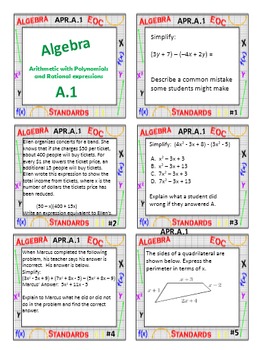
Algebra 1 Review Task Cards
This product covers the domains of Algebra, Functions, Numbers and Quantity, and Probability and Statistics, and includes:
- Task Cards by standard (306 total questions)
- Answer Keys by standard
- Student answer sheets
Each standard adopted by Louisiana for Algebra 1 is covered, however cards can easily be used in other states and by non-CCSS states.
These task cards are a great way to review throughout the year as well as at the end of the year before end of course tests. This allows stu
Subjects:
Grades:
7th - 10th
CCSS:
Version B End of Unit Assessment/Retake for IM Algebra 1 Math™ Unit 1
This is a Version B End of Unit Assessment aligned to Illustrative Mathematics, Unit 1 (One-variable Statistics) for Algebra 1. This Version B assessment is aligned to the same CCSS standards as the original exam and is modeled after the same type of problems accompanying Unit 1 for Algebra 1. So it naturally lends to standards based grading, if that is a practice in which you choose to participate. This exam can be used as a retake for students to show mastery after reteaching lessons or studen
Subjects:
Grades:
8th - 12th
Types:
CCSS:
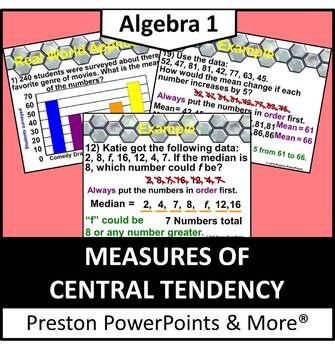
(Alg 1) Measures of Central Tendency in a PowerPoint Presentation
Algebra 1 Measures of Central Tendency in a PowerPoint PresentationThis slideshow lesson is very animated with a flow-through technique. I developed the lesson for my Algebra 1 class, but it can also be used for upper level class reviews. This lesson teaches how to find the mean, median, and mode of a data set, identify and remove outliers, explain the effects of changing values in data sets, and solve real-life data problems using graphs to organize as the most liked movie genre.This lesson h
Grades:
5th - 9th
CCSS:
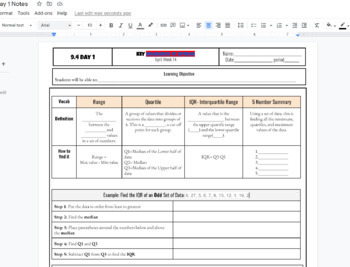
IQR interquartile Range and 5 number summary box and whisker plot Notes
IQR interquartile Range and 5 number summary box and whisker plot Notes including Q1, Q2, Q3, Min and Max and step by step both examples of finding the IQR and creating a box and whisker plot. Used in HS math 1 class WITH KEY INCLUDED AS a link to a printable PDF
Subjects:
Grades:
7th - 12th, Higher Education, Adult Education
CCSS:
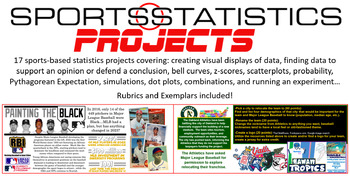
Sports Statistics - Projects ONLY! 17 projects in all
Most of the projects allow students to choose their own topic to display their understanding of statistical topics. Students will:Create a graph of their choosing given dataDesign an infographic on the subject of their choosingResearch and defend their G.O.A.T. choice in a variety of categoriesUse demographics to relocate and rebrand a professional franchiseResearch social injustices in sports and display the dataCreate a bell curve based on career statistics of Michael JordanCompare the salari
Subjects:
Grades:
8th - 12th
CCSS:
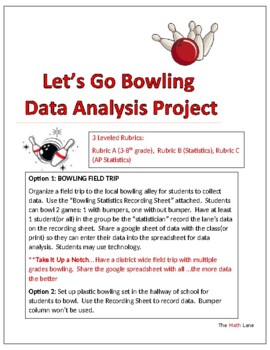
Let's Go Bowling Statistics STEM Project & Field Trip (3-12 and AP Stat)
Great END OF YEAR project. Get ready to strike up some fun with your students on a field trip to the bowling alley or right in your own hallway with a plastic bowling set! This isn't just any ordinary field trip - it's a real-world data collection extravaganza. 3 different leveled rubrics (Grade 4-10, Statistics, AP Statistics) so students can analyze the data based on their math knowledge. Students will be able to practice creating and analyzing graphical displays, scatterplots, construct c
Subjects:
Grades:
Not Grade Specific
Types:
Also included in: High School Statistics Project Bundle
High School Math IEP Goal Bank - Statistics and Probability
This IEP goal bank was created to assist special education teachers with the task of writing standards-based IEP goals in math. After spending countless hours developing IEP goals myself and really having to think through how to best individualize goals and objectives for my own students, I wanted to share this resource to help other special education teachers gain back some of their time.This goal bank includes the following:An introduction and guide that explains how to use the document.Each s
Subjects:
Grades:
9th - 12th
CCSS:
AP Statistics Kahoots (10 total): No Prep game/activity for AP Statistics Exam
Get ready to supercharge your AP Statistics exam prep with these 10 Kahoot links! With 10-15 questions in each Kahoot, your students will have daily practice to help them ace the exam at the end of the year. These Kahoots are specifically designed using AP test material, so you can be sure your students are getting the best preparation possible. Perfect for quick spiral review, warm-ups, or closing out class, these Kahoots are the ultimate tool for helping your students succeed. And with the opt
Subjects:
Grades:
10th - 12th
Types:
CCSS:
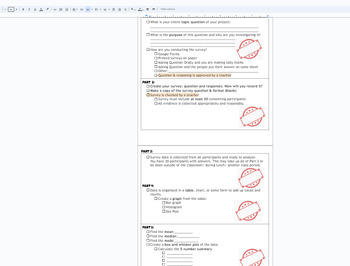
Statistics Survey project Discovery (broken down into sections) with Rubric
This is a broken down (scaffolded) packet of instructions/ guide for a Stats Project for Math 1 HS or 8th grade students. The goal of the project is for students to take a statistical survey on quantitative data (numbers) of their choice. Using this data from the survey, the following will be included in the project:Survey- the question being askedSurvey responses (requirement of 30)Data organization: Bar chart, Histogram, Dot PlotMeanMedianModeBox and Whisket Plot5 number summary (Q1,Q2,Q3, min
Subjects:
Grades:
7th - 12th, Higher Education, Adult Education
CCSS:
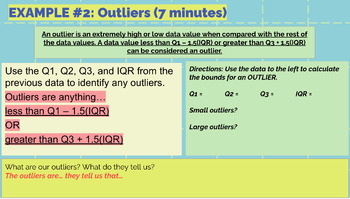
Lesson 2 PPT: One-Variable Data: Box Plots, Measures of Center and Variability
Hi! This is Part 2 of the lessons for One Variable Data for High School Statistics. Part 1 can be found on my product listings in my store. This lesson covers measures of central tendency (mean, median, mode), measures of variability (range, standard deviation, IQR), and how to create box plots. It includes guided practice during the lesson and think-write-pair-shares for students to engage in during the lesson.It's best downloaded into Google Drive and edited as you need for your class. If you
Subjects:
Grades:
10th - 12th
Types:
CCSS:
Statistics Unit 2 Bundle - Frequency Distributions Curriculum (6 days)
This is a unit plan bundle for a Statistics class. The plans include common core math standards, time frame, activities, enduring understandings, essential questions, and resources used. It is designed to last 6 days. The plans include: 21-slide presentation, with annotated guide for reference2 Worksheets"Do Now" Entrance problemsSpreadsheet Activity - "Spreadsheets and Heartbeats"Unit ReviewUnit TestGraphing Calculator instructions included on slidesPacing guide with administrative unit planAll
Subjects:
Grades:
9th - 12th, Higher Education
CCSS:
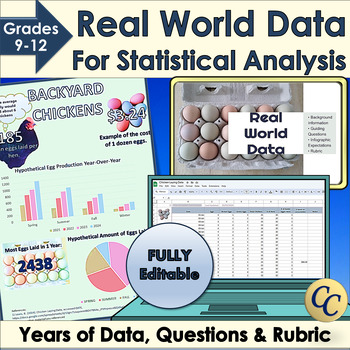
Real World Data for Statistical Analysis and Infographic Project
Give your students access to real world data for your statistical analysis unit or data literacy! Dive into statistics with Microsoft Excel™ or Google Sheets™ and years of data. Learn how to use standard deviation, mean or median to interpret data. Choose the best graphs to display conclusions in an infographic. Works great for science fairs! ✔ Includes an infographic project! (Template, expectations, and rubric). ✔ Everything is fully editable and you and your students can even use the images
Grades:
9th - 12th
Types:
CCSS:
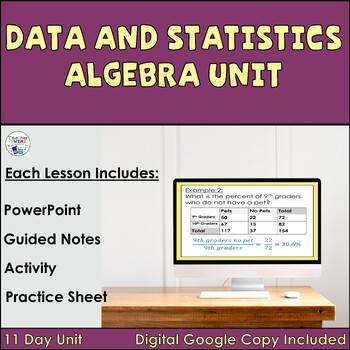
Data and Statistics for Algebra Unit
Make lesson planning easy with this no-prep Data and Statistics for Algebra Unit! Included are 11 ready-made lessons. This unit is very easy to use and will save you a lot of time!Use the Data and Statistics for Algebra Unit to cover Algebra 1/Math 1 data and statistic topics. You will enjoy the ease of using our editable PowerPoints with guided notes. Students will love the Algebra lessons when you use the included activities for each lesson! Great Algebra Lessons to use for Home School!The Dat
Grades:
8th - 9th
CCSS:
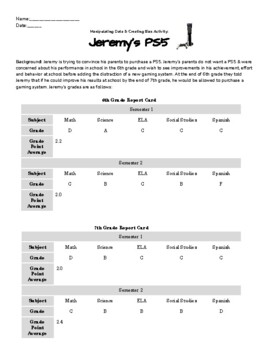
Manipulating Data & Creating Bias Activity
Manipulating Data & Creating Bias Activity: Teach your students about how charts and statistics can be skewed; and real numbers can reflect bias with this fun project! Students are given a role (either Jeremy or his parents) and have to use two pieces of data from Jeremy's 6th & 7th grade report card to argue for or against his deserving of a PS5!Students get to be creative & make cross-curricular connections to ELA as they use logical fallacies & skewed graphs to make their argu
Subjects:
Grades:
4th - 11th
Types:
CCSS:
NGSS:
HS-ETS1-4
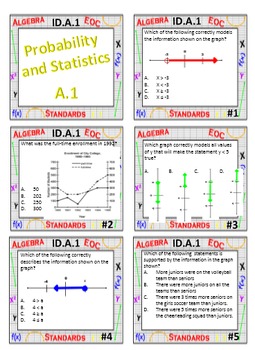
Algebra 1 Review Task Cards - Probability and Statistics
This product covers the domain of Probability and Statistics for Algebra 1 and includes:
- Task Cards by standard (50 total questions)
- Answer Keys by standard
- Student answer sheets
Each standard adopted by Louisiana for Algebra 1 in the Probability and Statistics domain is covered, however cards can easily be used in other states and by non-CCSS states. For a a FREE checklist and description of the standards, please check our store.
These task cards are a great way to review throughout th
Subjects:
Grades:
7th - 10th
Types:
CCSS:
Showing 1-24 of 146 results

